Home
Browsing Animations: Kinematics
21 Animations
040301.iwp
A cannonball is launched horizontally from a cannon on a cliff. What must the initial velocity be for the ball to hit the target?
040302.iwp
A cannonball is launched from ground level at 45 degrees. What must the magnitude of the initial velocity be in order for the ball to hit the target?
040303.iwp
A cannonball is launched from ground level. The angle of launch can be changed. For any target position, what values can the launch angle have in order for the ball to hit the target?
040304.iwp
A cannonball is launched from ground level. The angle of launch can be changed. For any particular launch angle, how can you calculate the maximum height of the ball, the time to reach that height, and the maximum range of the ball?
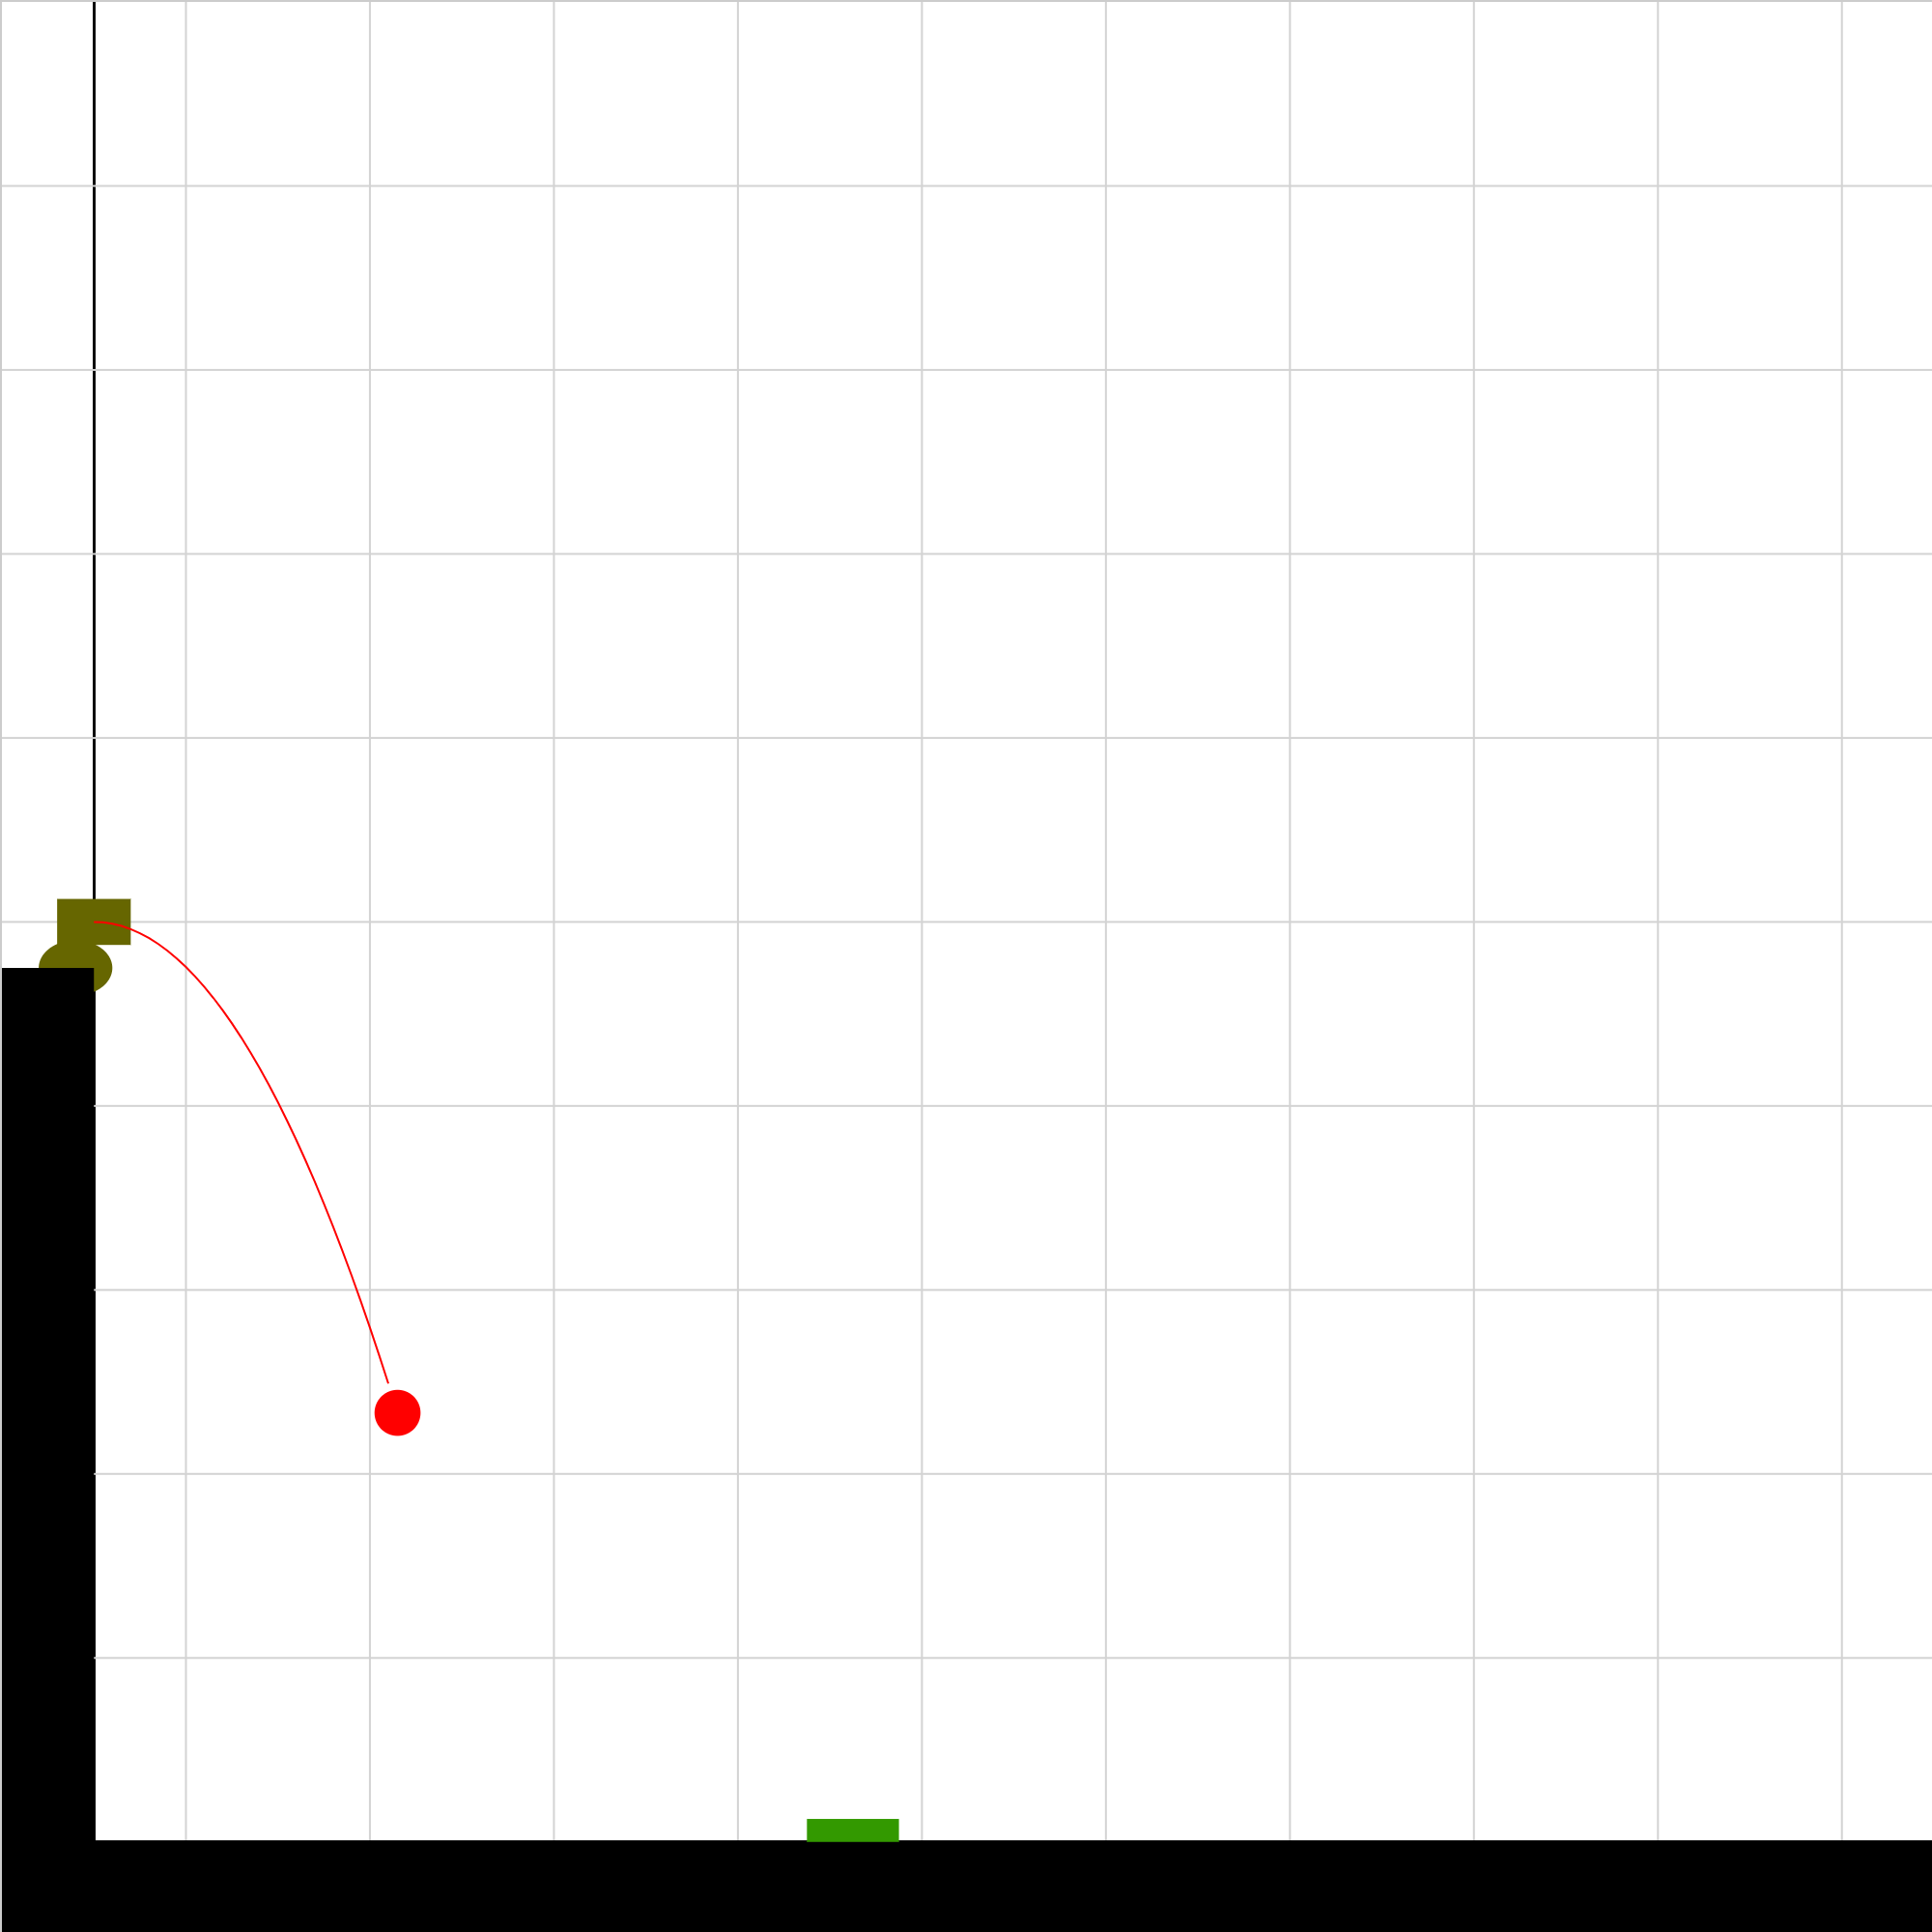
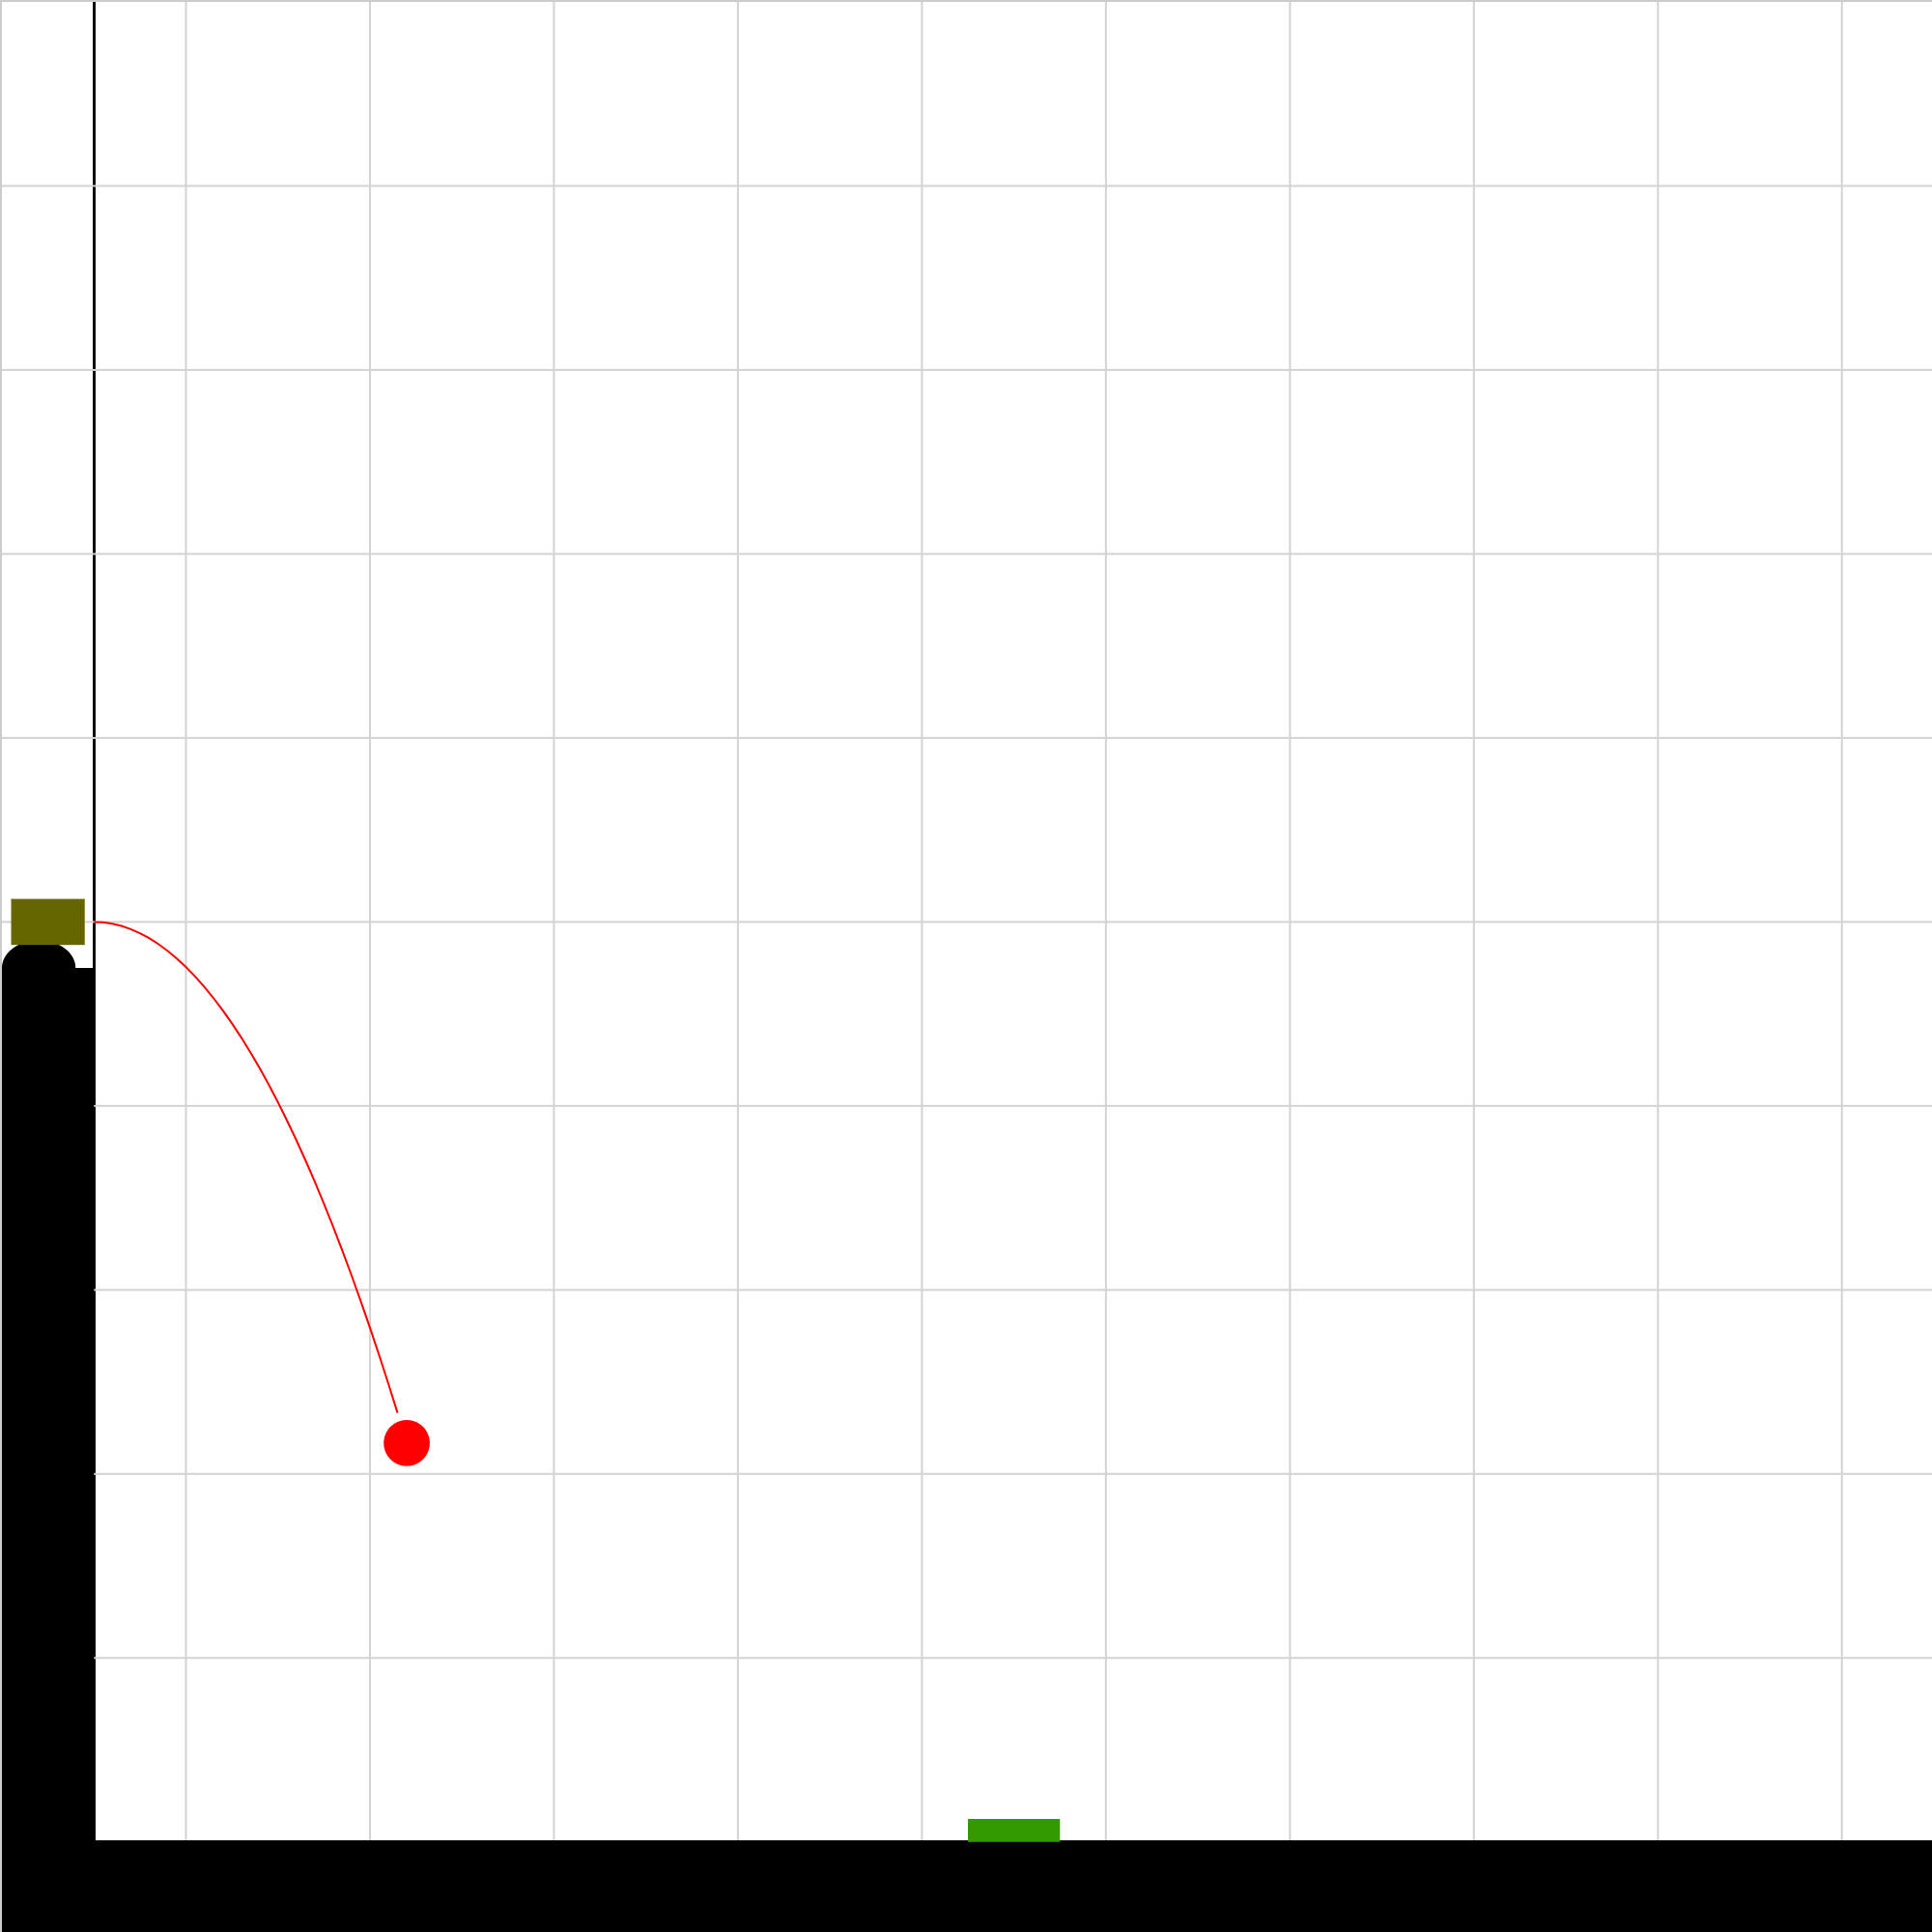
040305.iwp
A cannonball is launched from a cannon on a cliff. What must the launch velocity be for the ball to hit the moving target? How does this depend on the launch angle?
acceleration01.iwp
Play the animation to view an object moving horizontally across the screen. Its acceleration is uniform. Step through the animation and take measurements of x-position and time to use for finding the acceleration. The object enters the field of view at -10.0 m and leaves (momentarily) at +10.0 m. Tic marks are placed every meter. Read positions of one side of the object to the nearest 0.1 m.
dvat-10.iwp
Play the applet to show a position vs. time graph of an object having the given initial velocity and acceleration. Sketch your predictions for the shapes of the corresponding velocity vs. time and acceleration vs. time graphs. Then click on Show graph to check your predictions.
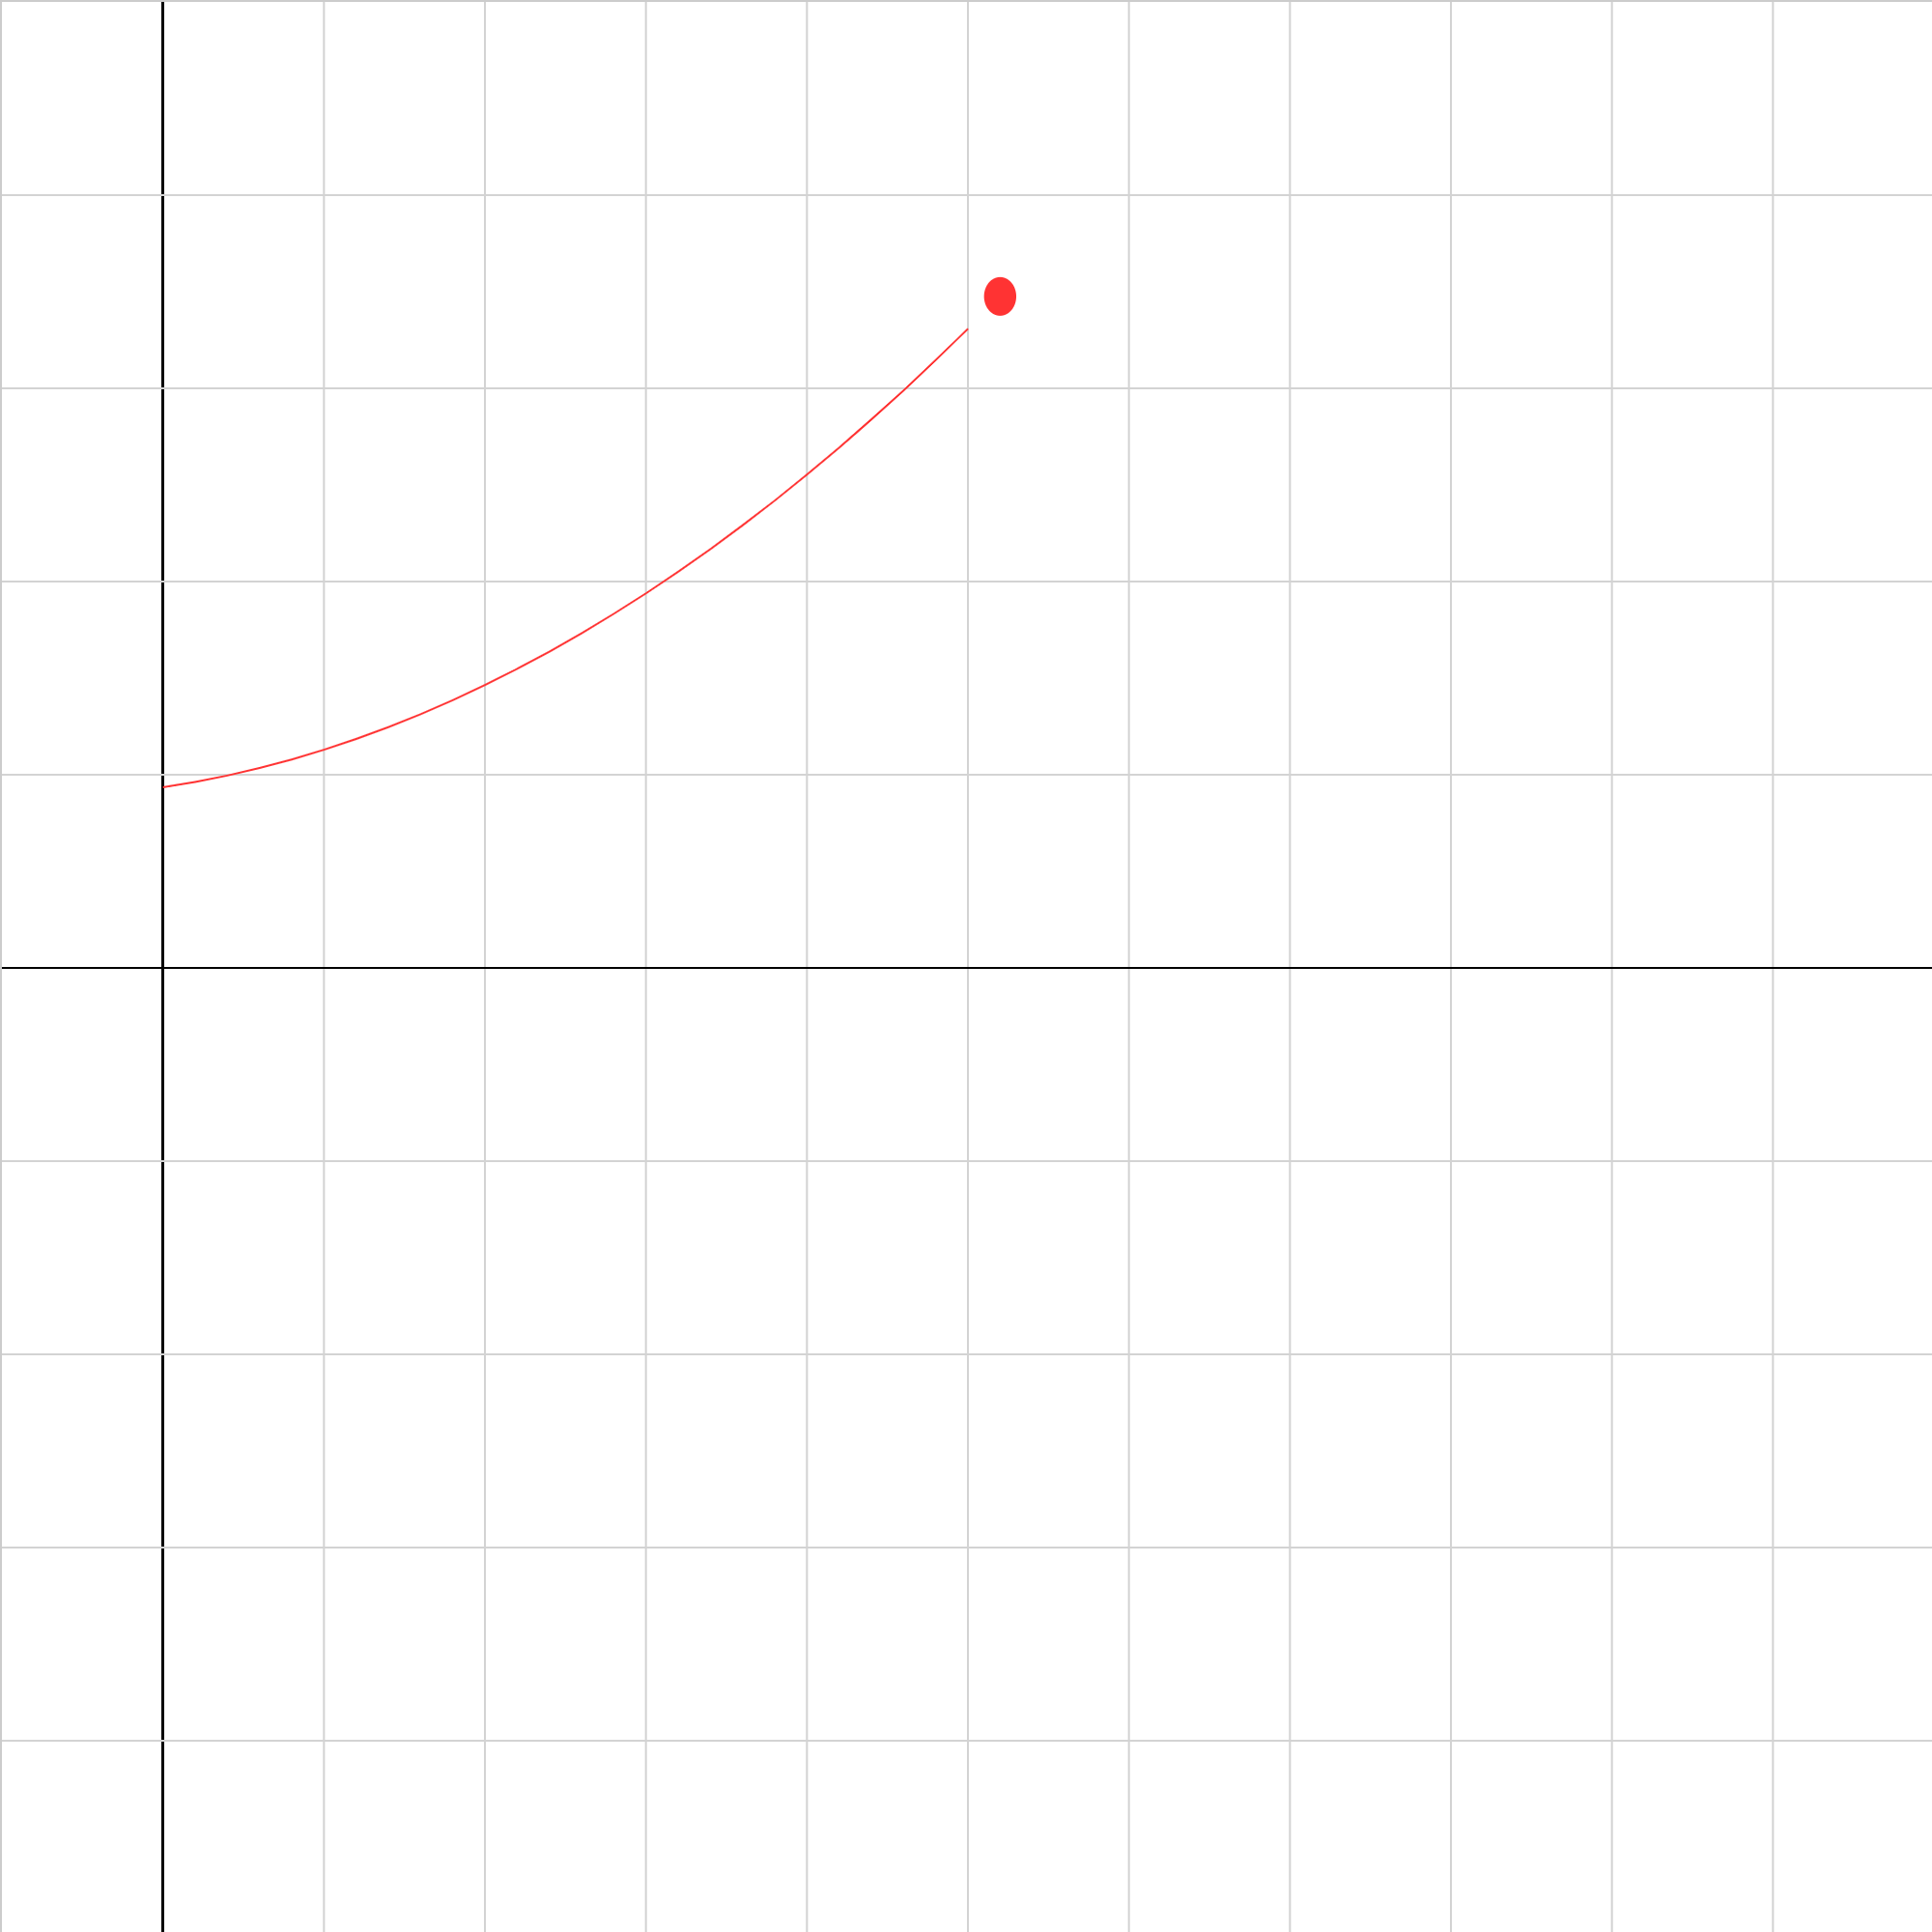
kingraph1.iwp
Play the applet to show a position vs. time graph of the blue dot. In your notes, sketch your predictions for the shapes of the corresponding velocity vs. time and acceleration vs. time graphs. Then click on Show graph to check your predictions.
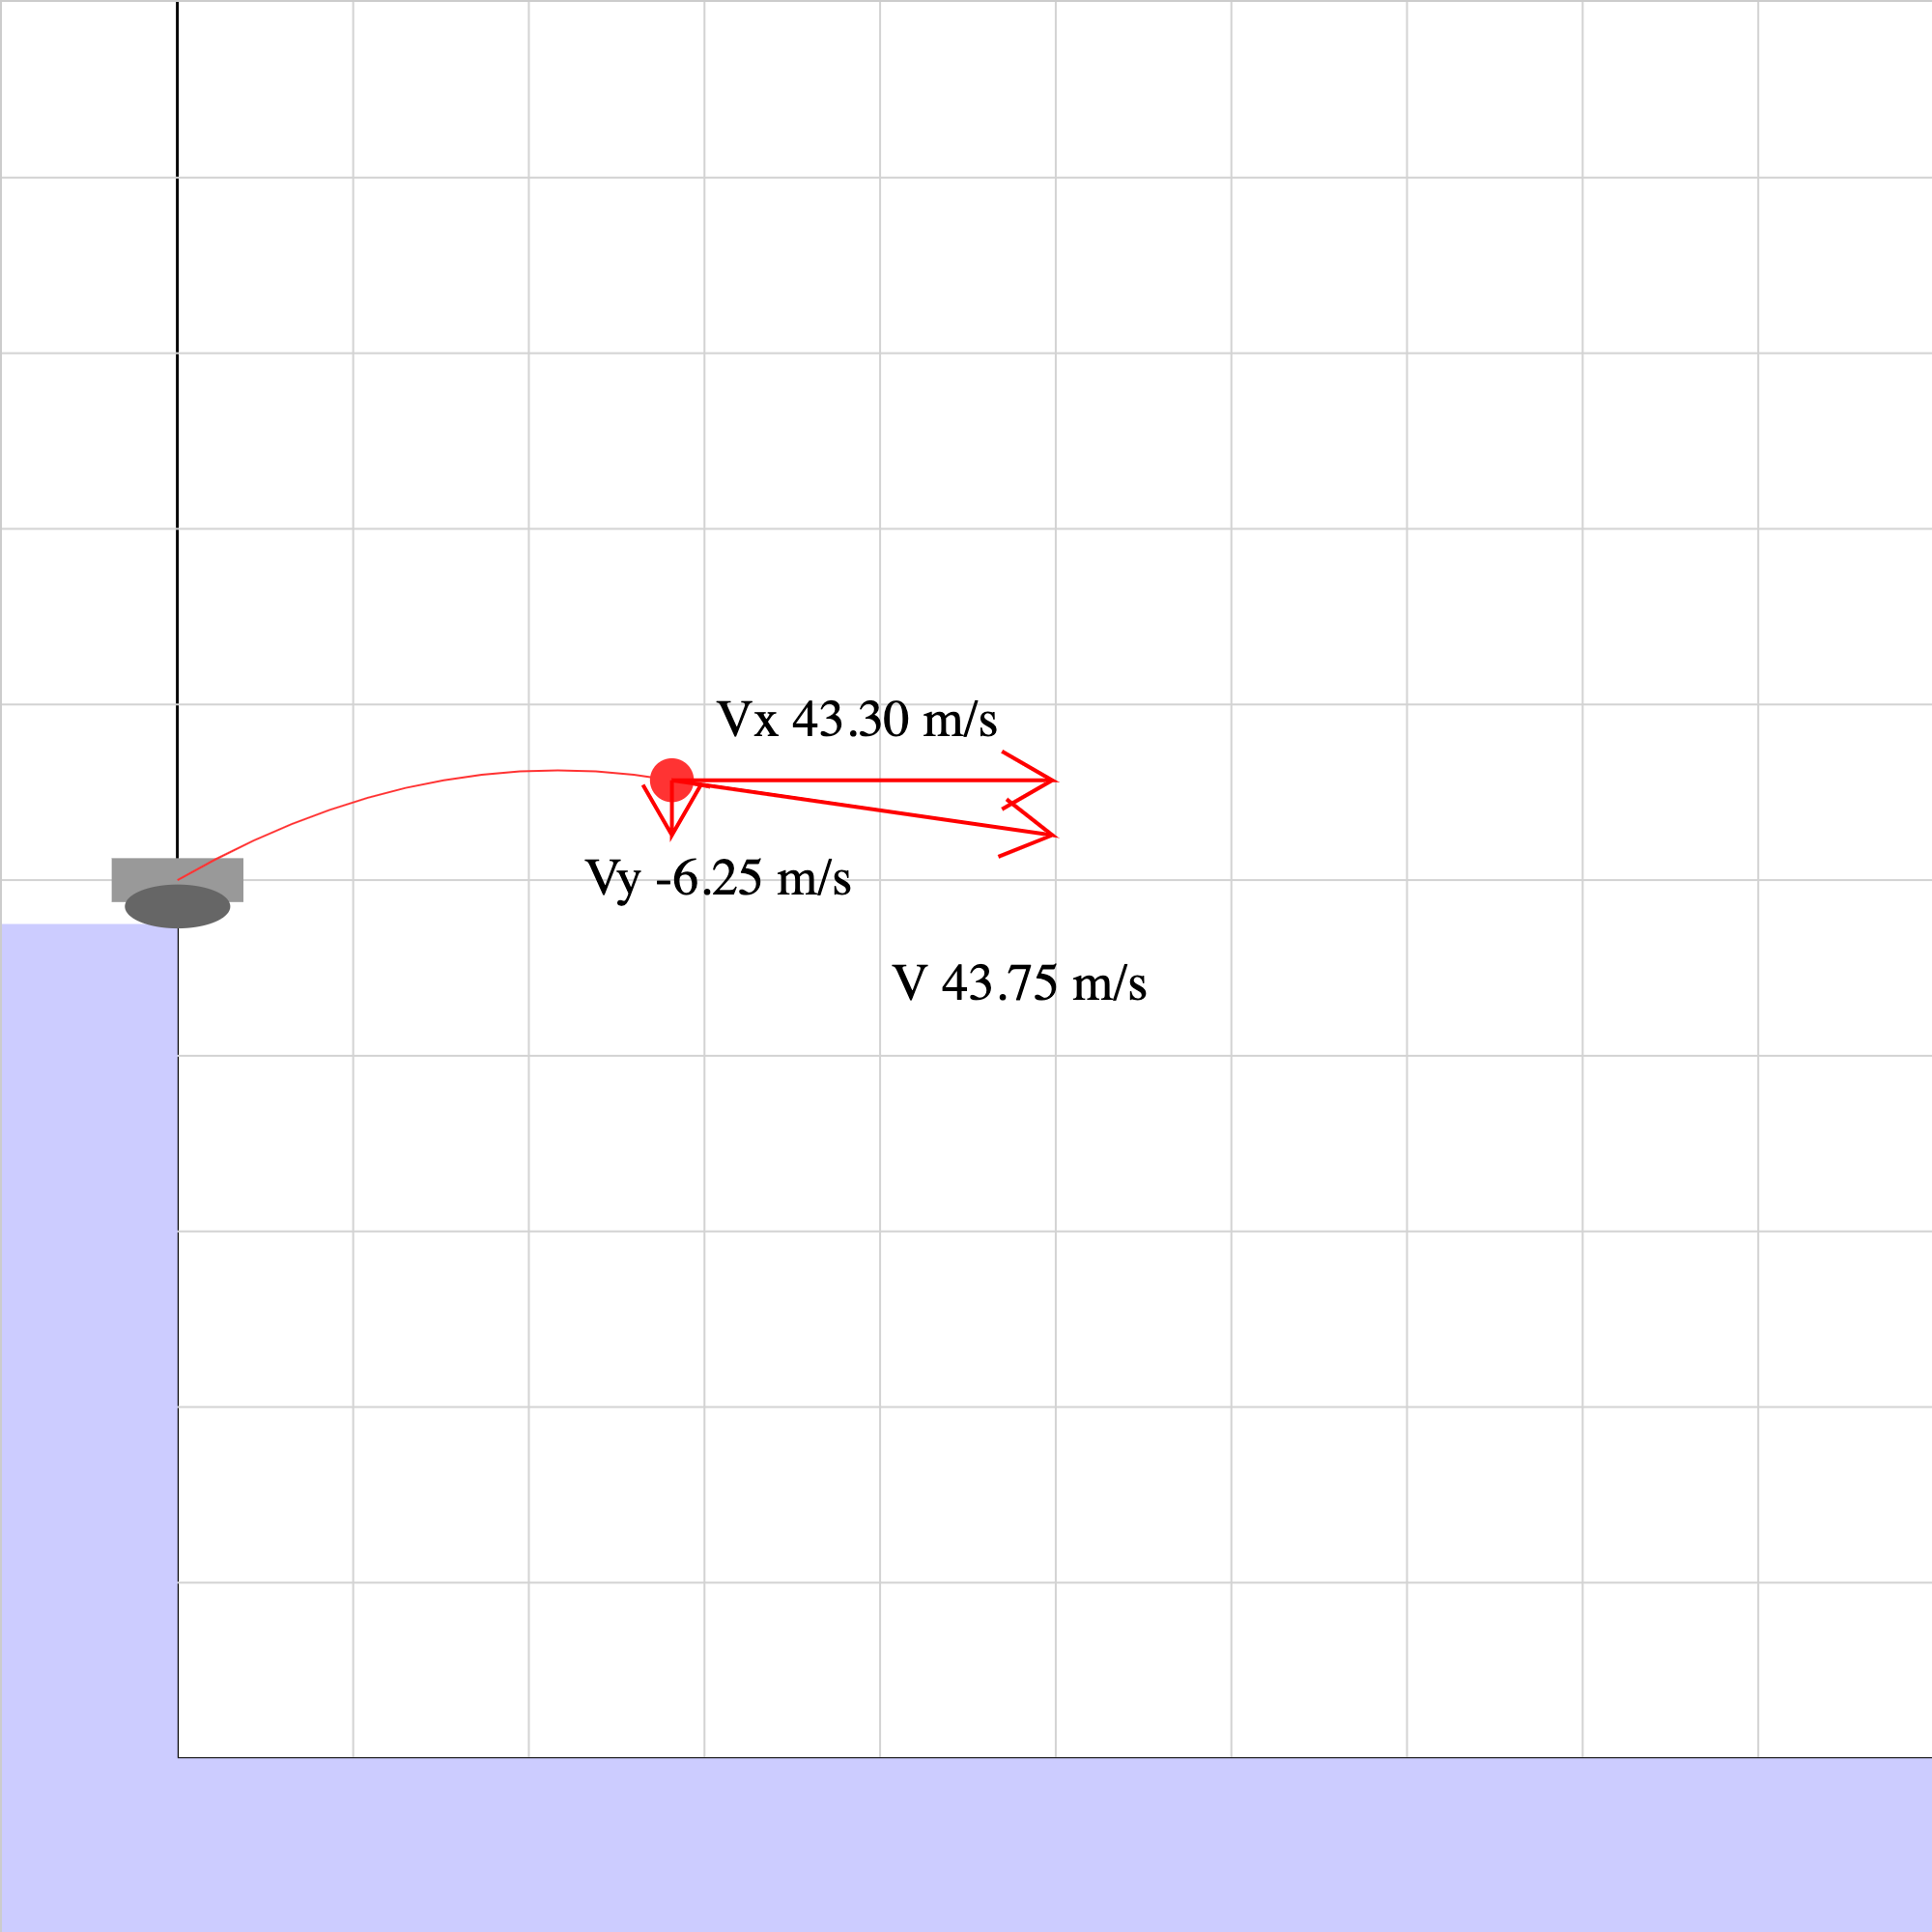
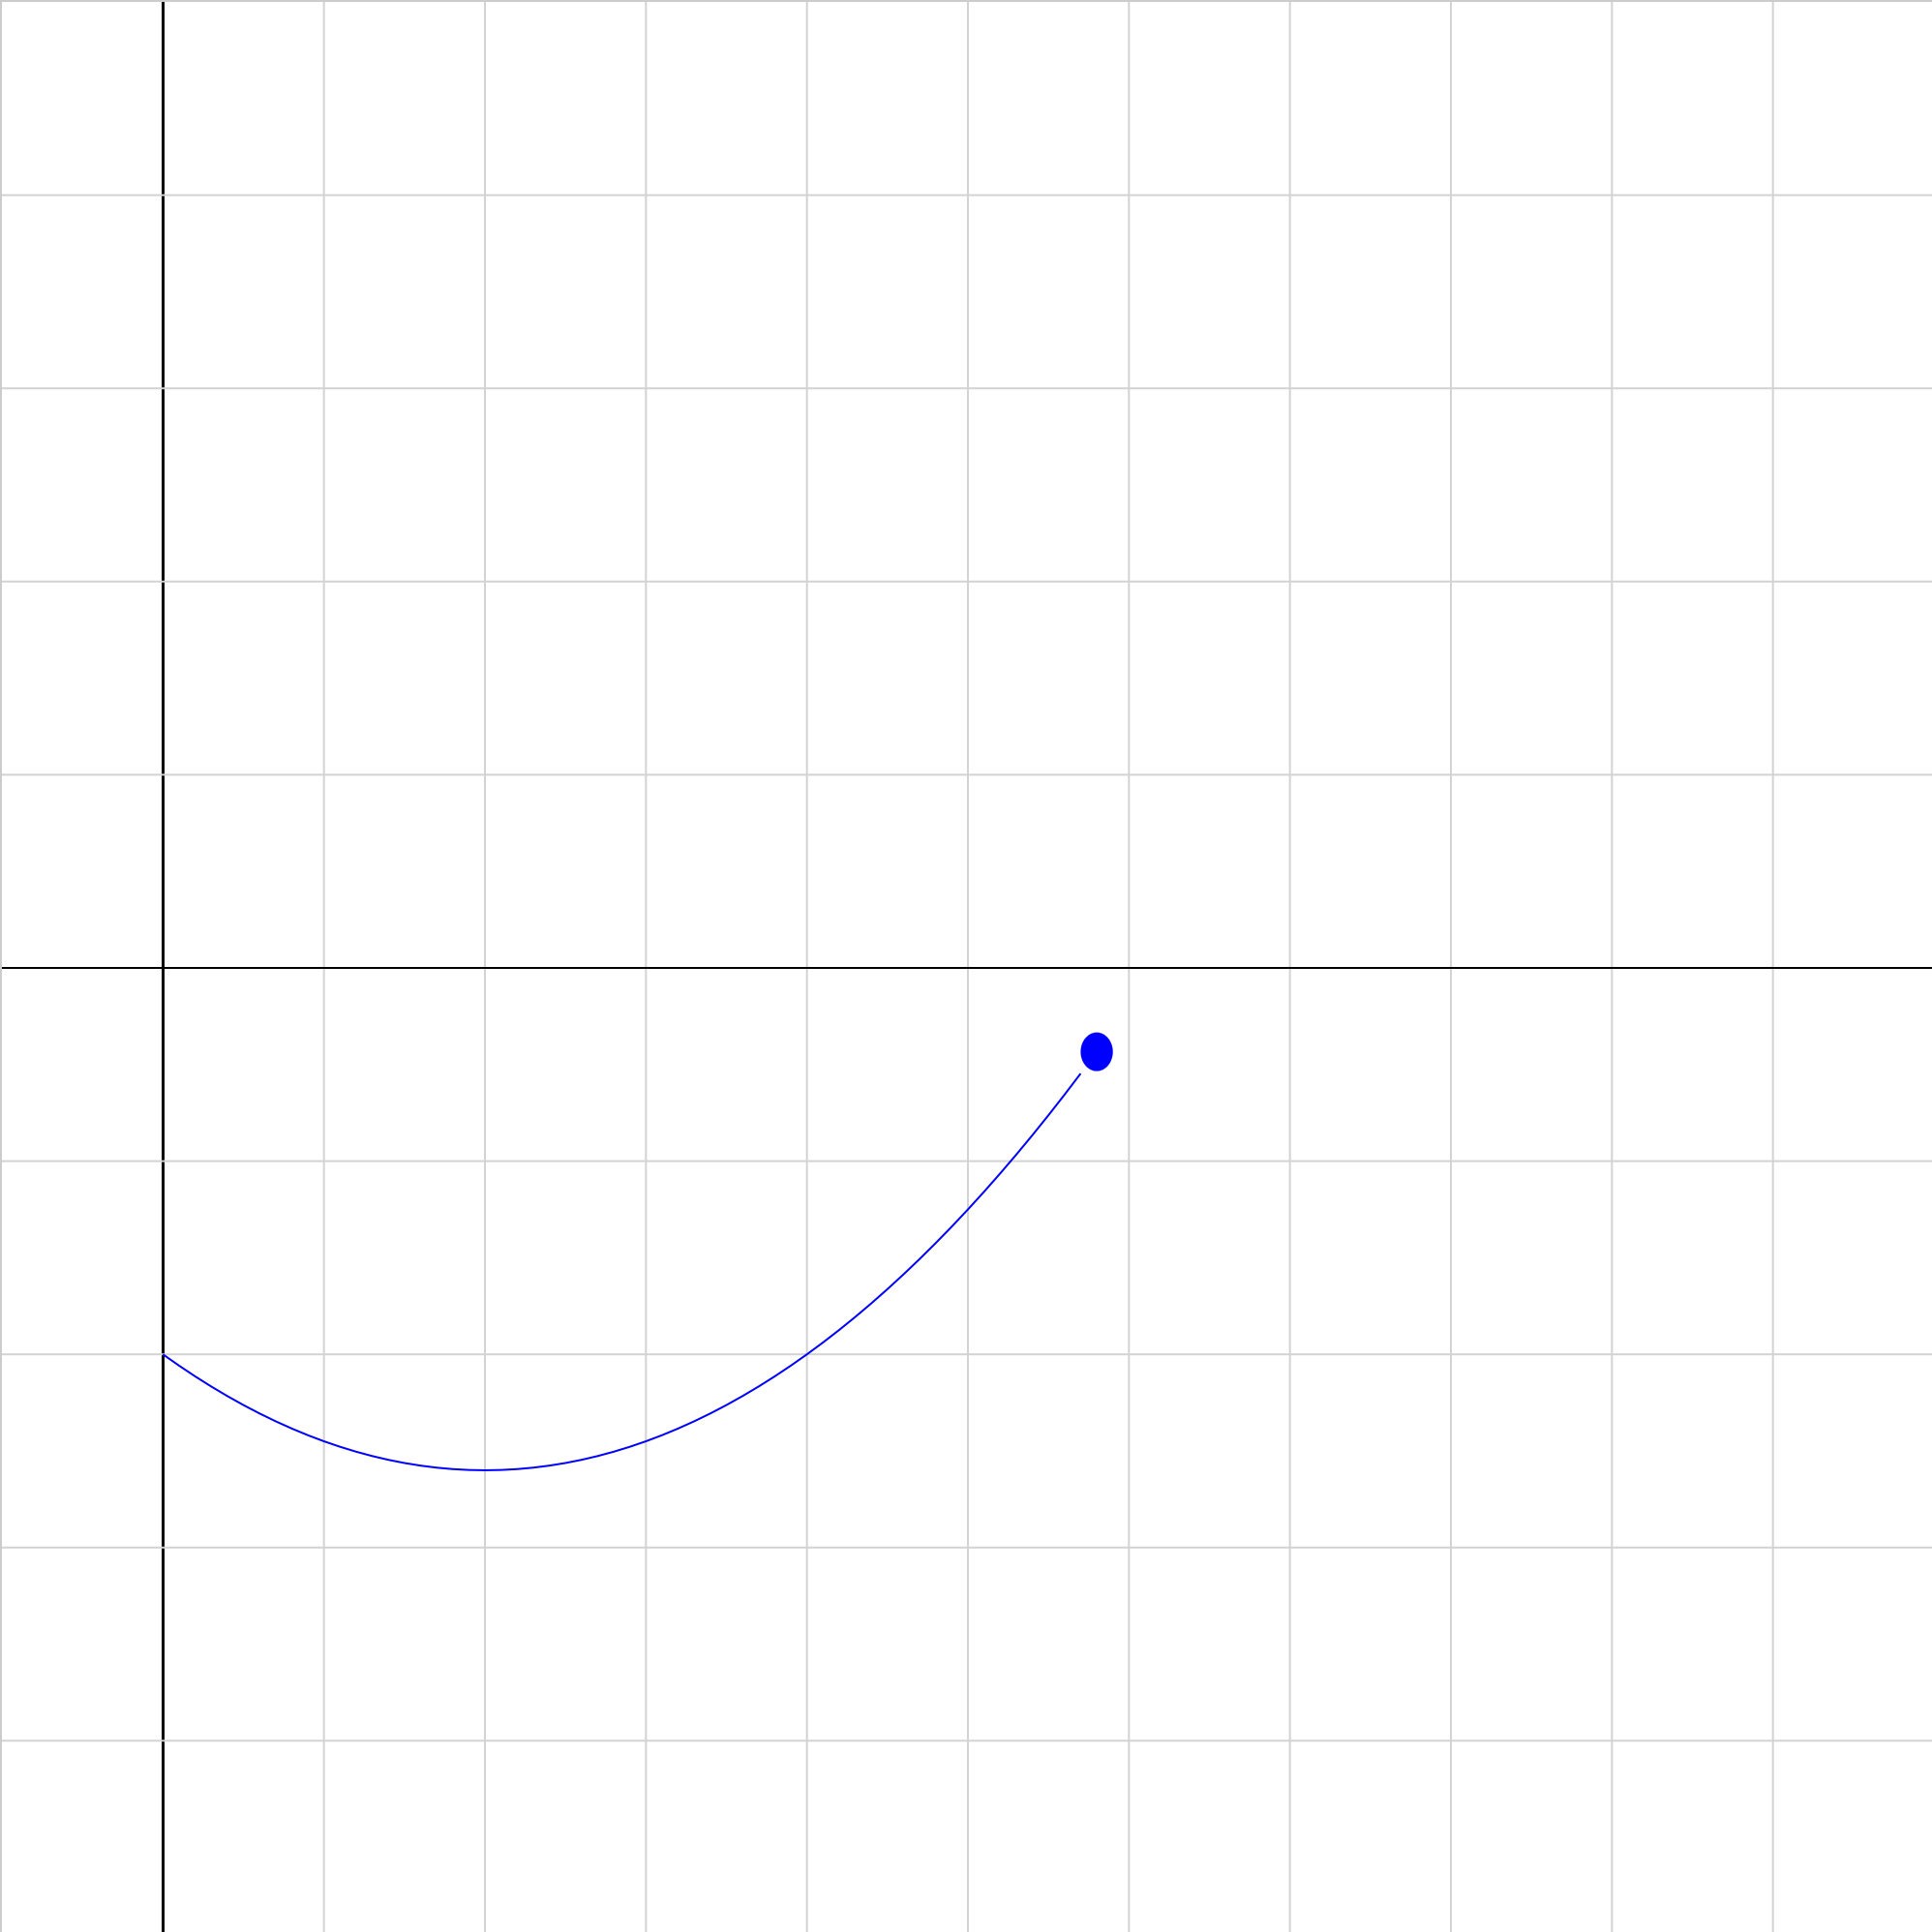
proj-vect-00.iwp
A projectile is launched at an angle from a cliff on an unkown planet. Velocity vectors are shown on the projectile. Use the velocity vectors at two instants of time to determine the acceleration of the object.
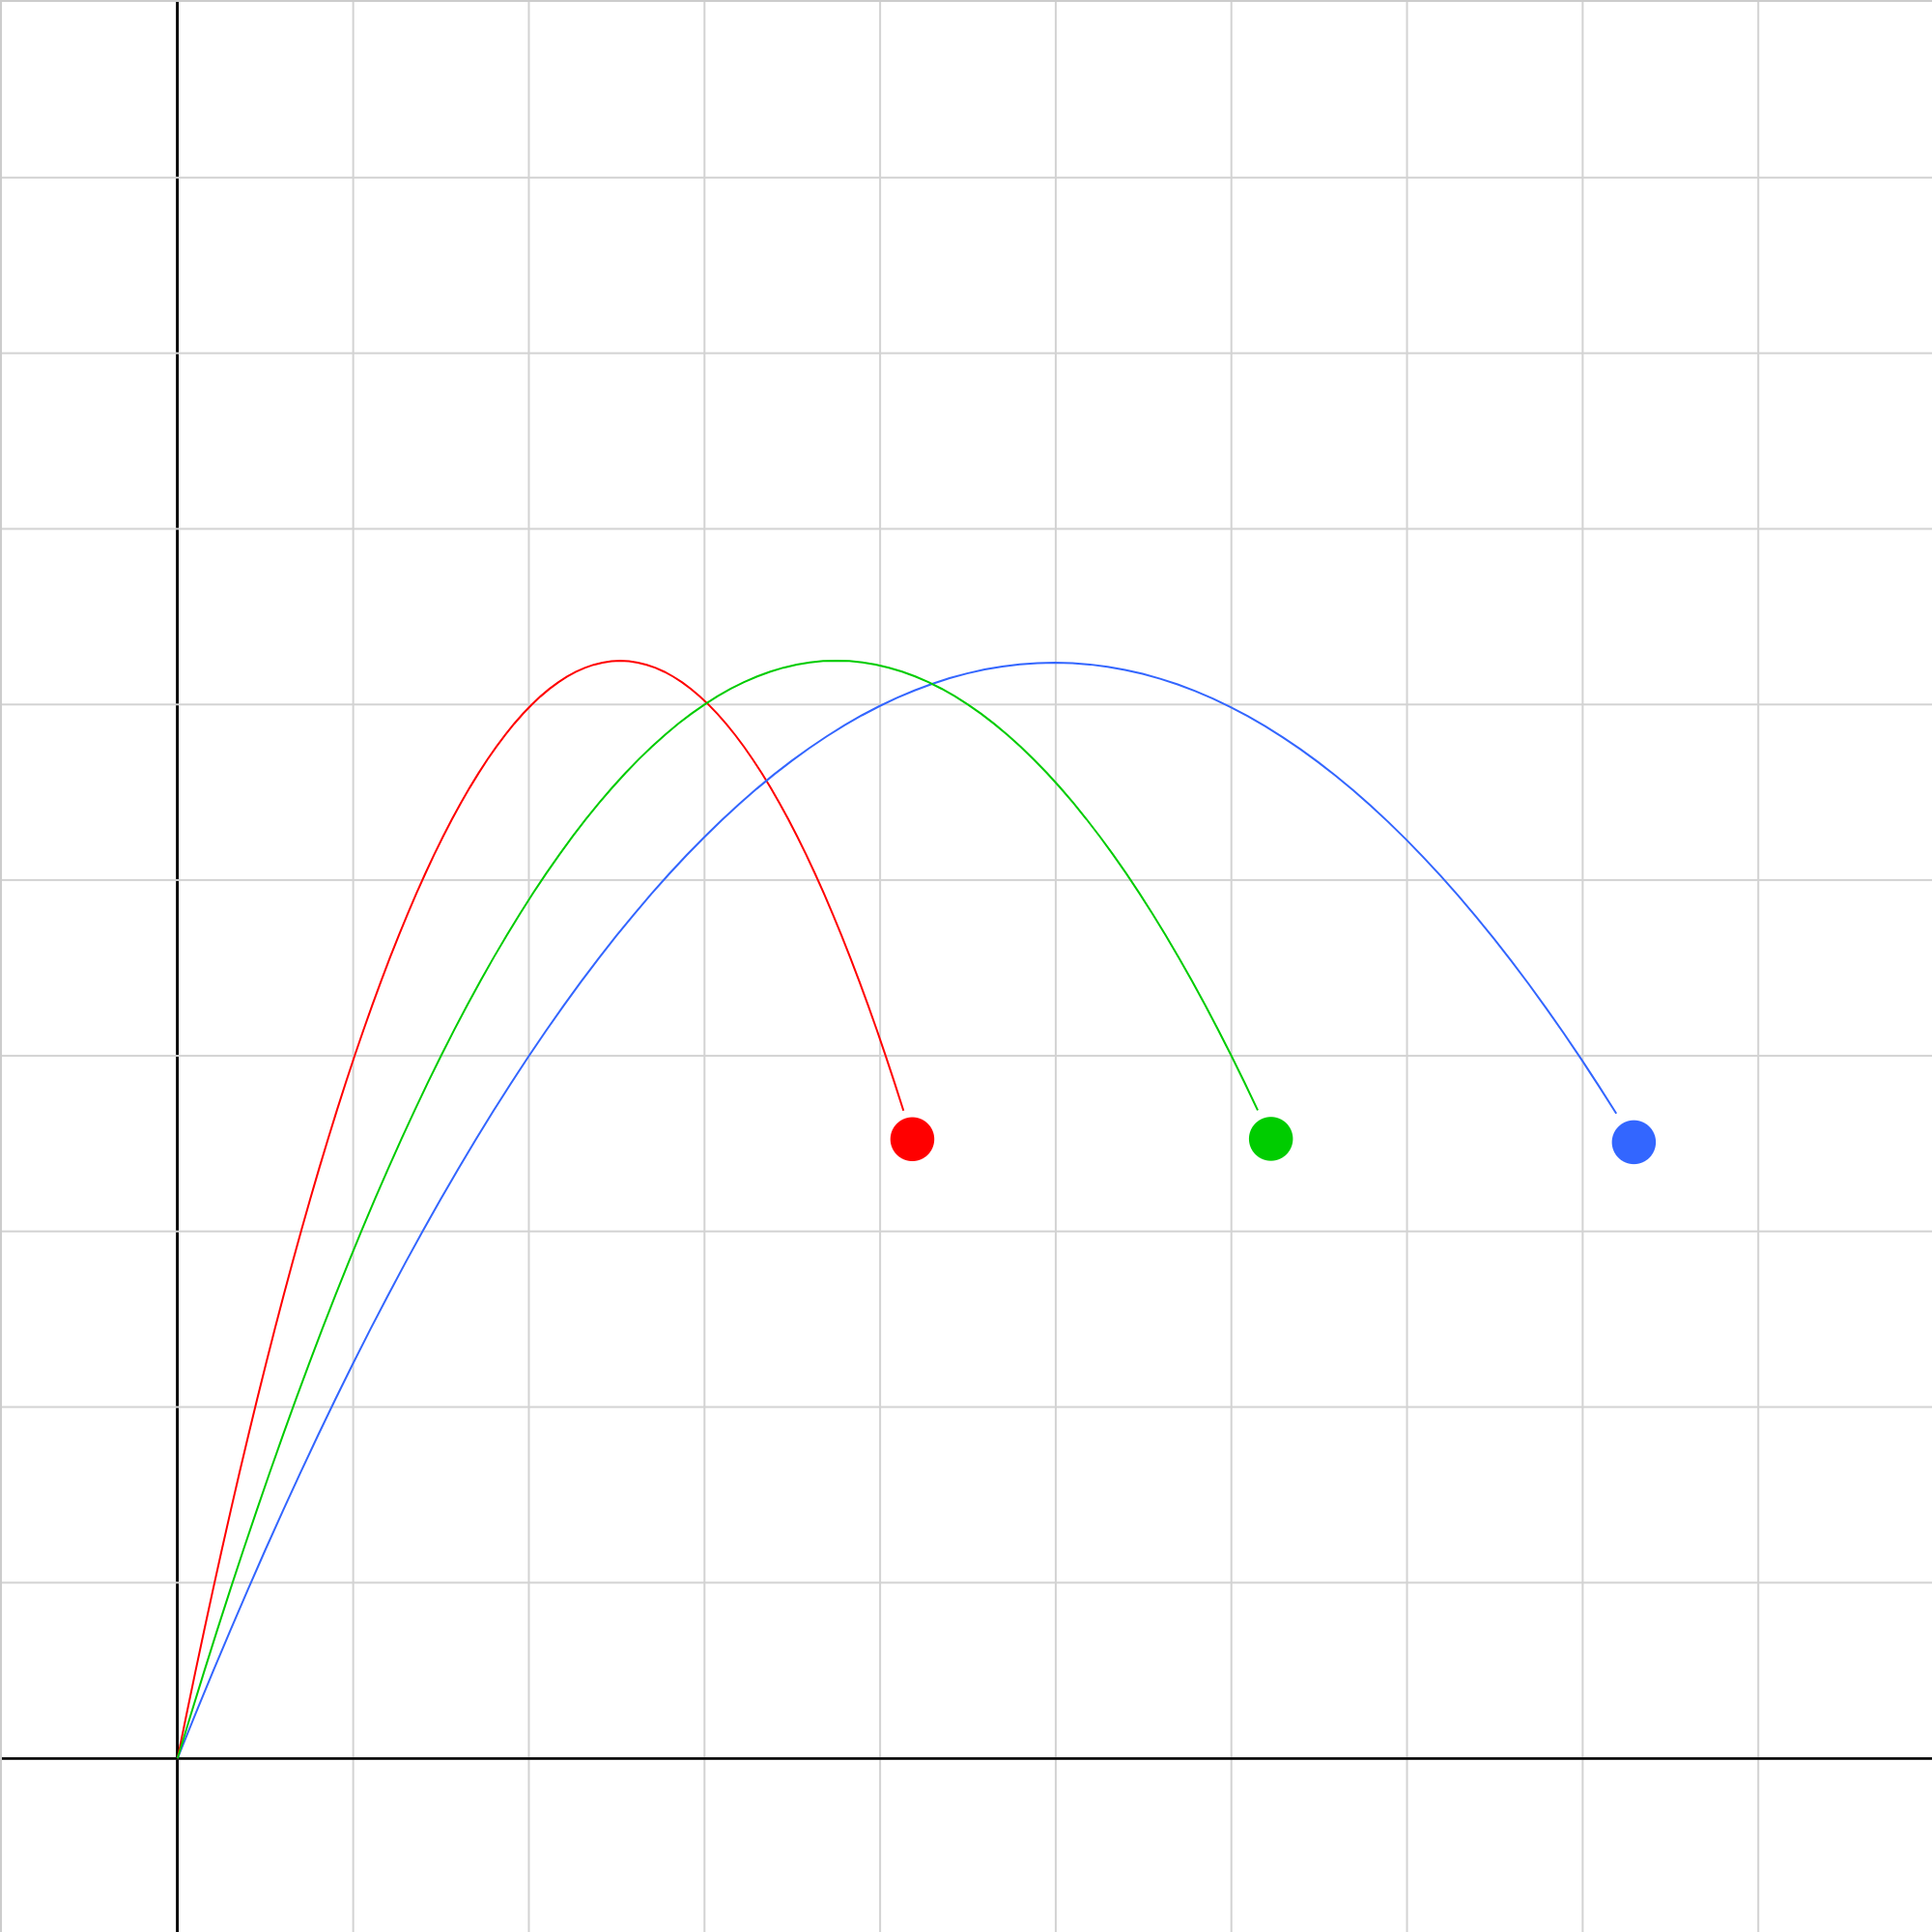
projectile-compare-1.iwp
Three projectiles are launched with different initial velocities and reach the same maximum height. Denote the paths as follow: A: red B: green C: blue List the projectiles in order of a) increasing initial speed and b) time of flight.
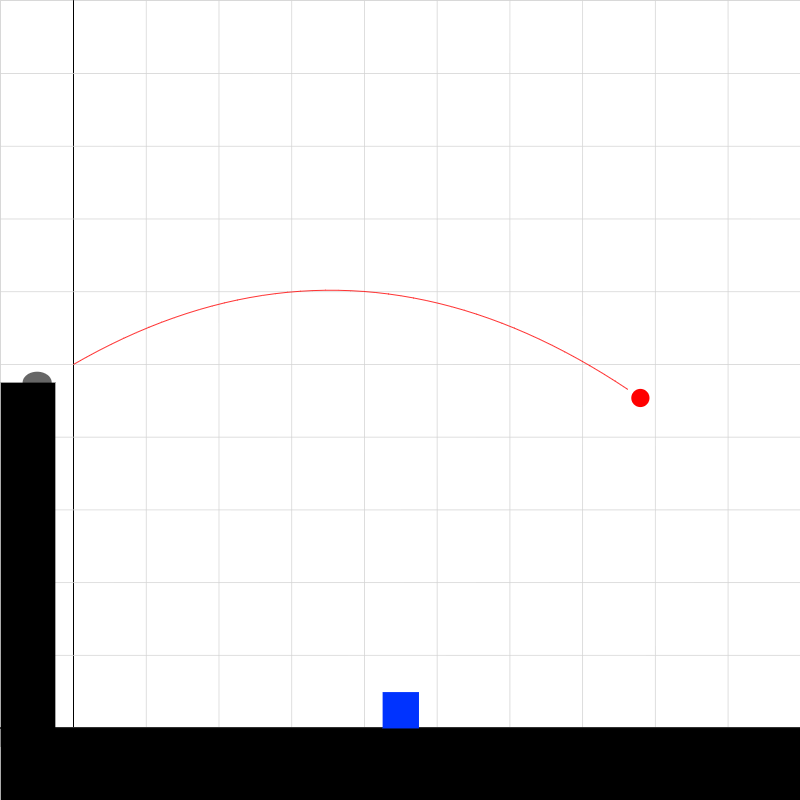
projectile-problem-1.iwp
A red ball slides off a table. Ignoring friction, which animation correctly represents the path of the ball? Enter 1, 2, 3, or 4 to change animations. The horizontal and vertical positions, velocities, and accelerations of the ball are shown under Outputs.
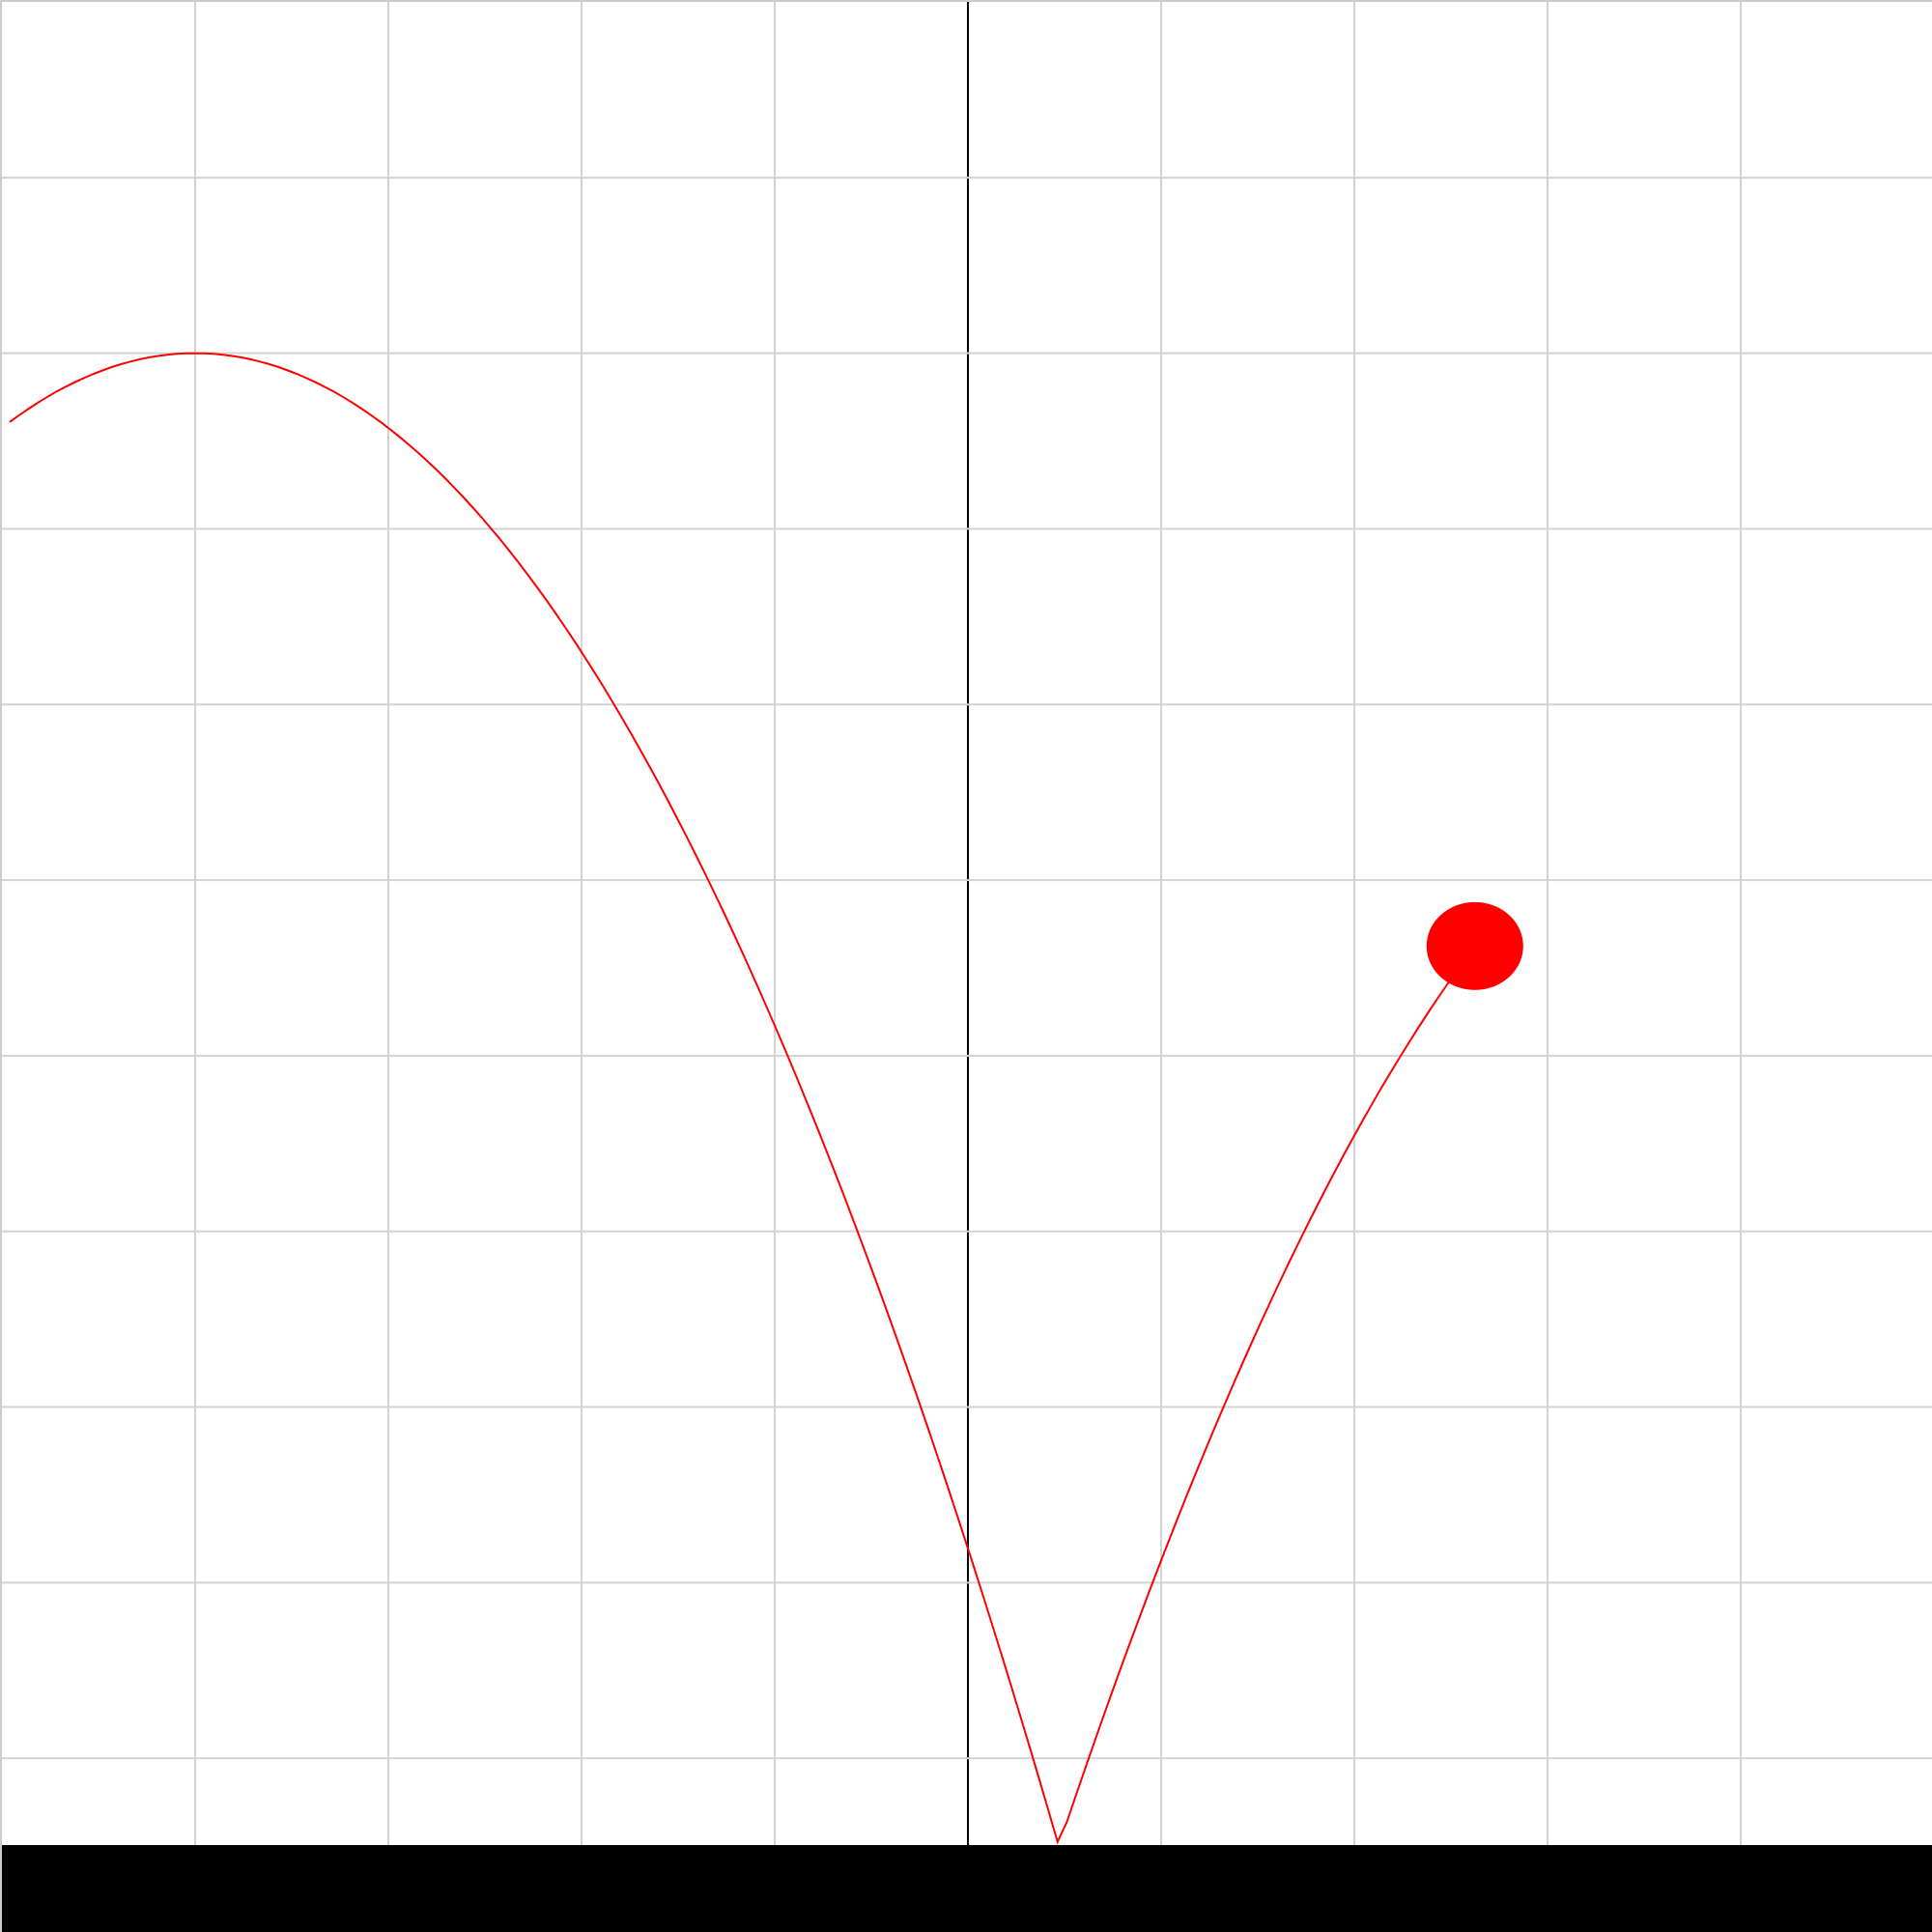
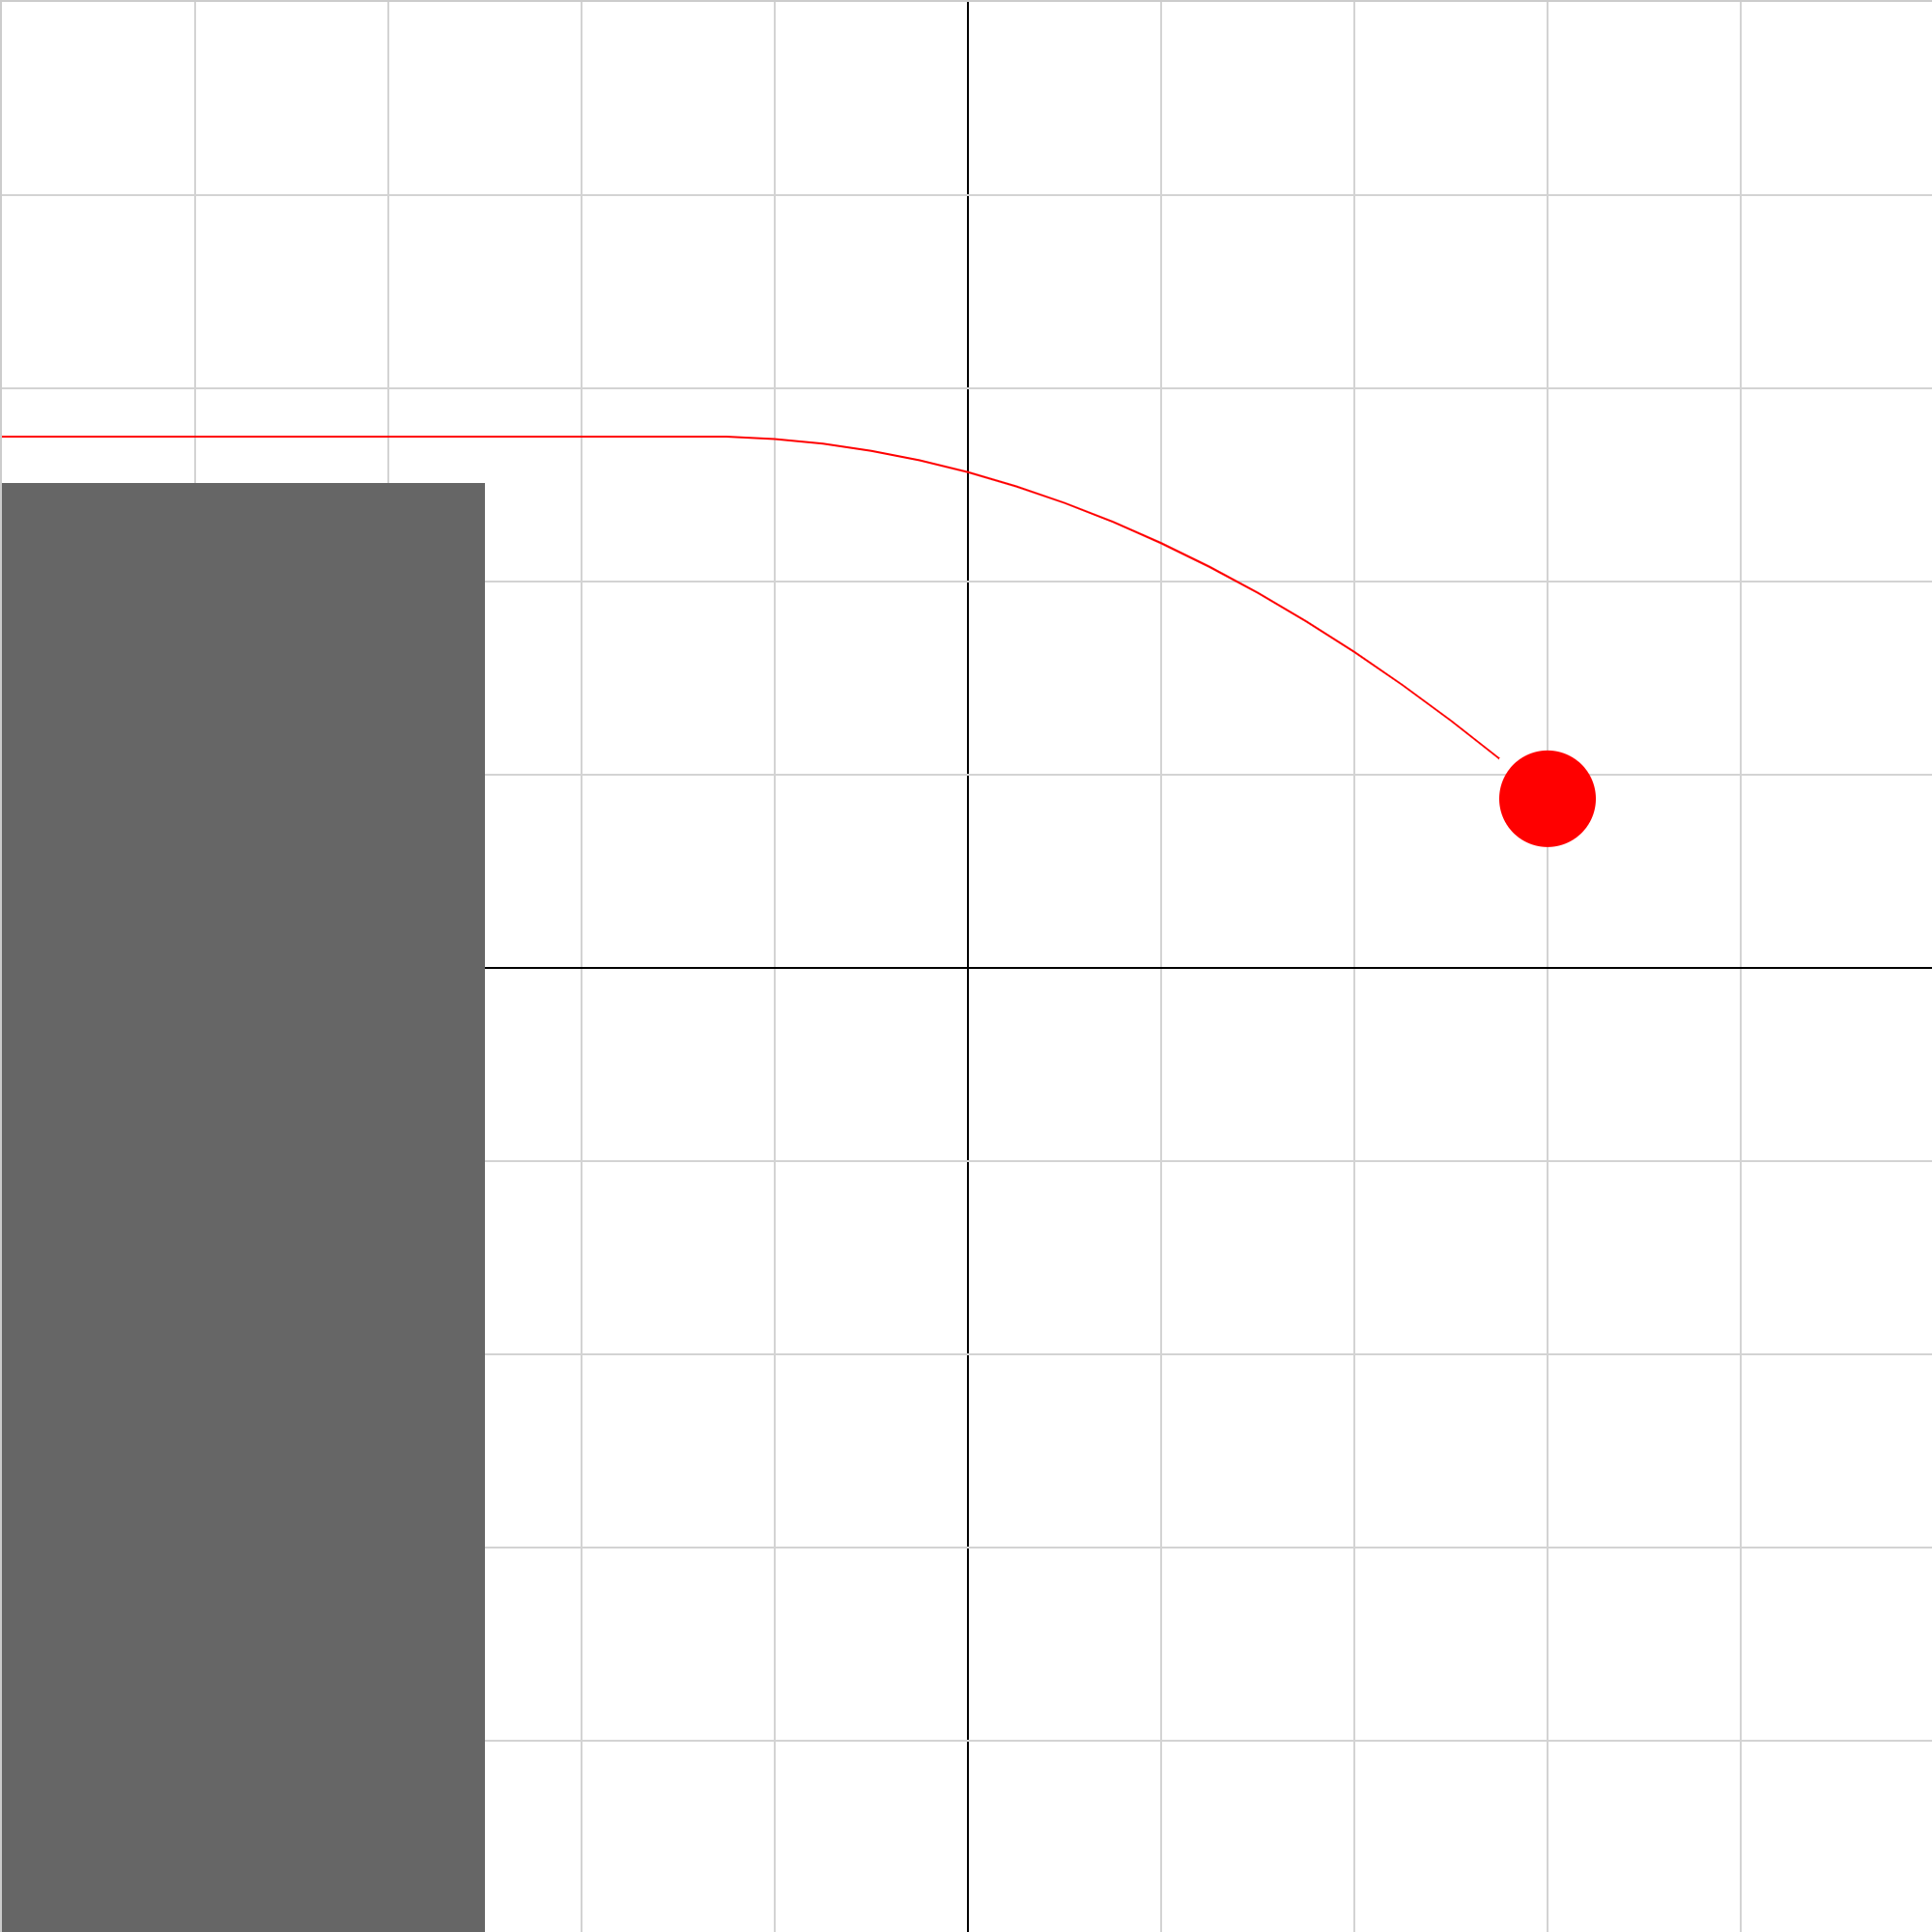
projectile-problem-2.iwp
A bouncing ball is shown in the animation. What is the ratio of the vertical velocity of the ball just after it hits the ground to the vertical velocity of the ball just before it hits the ground?
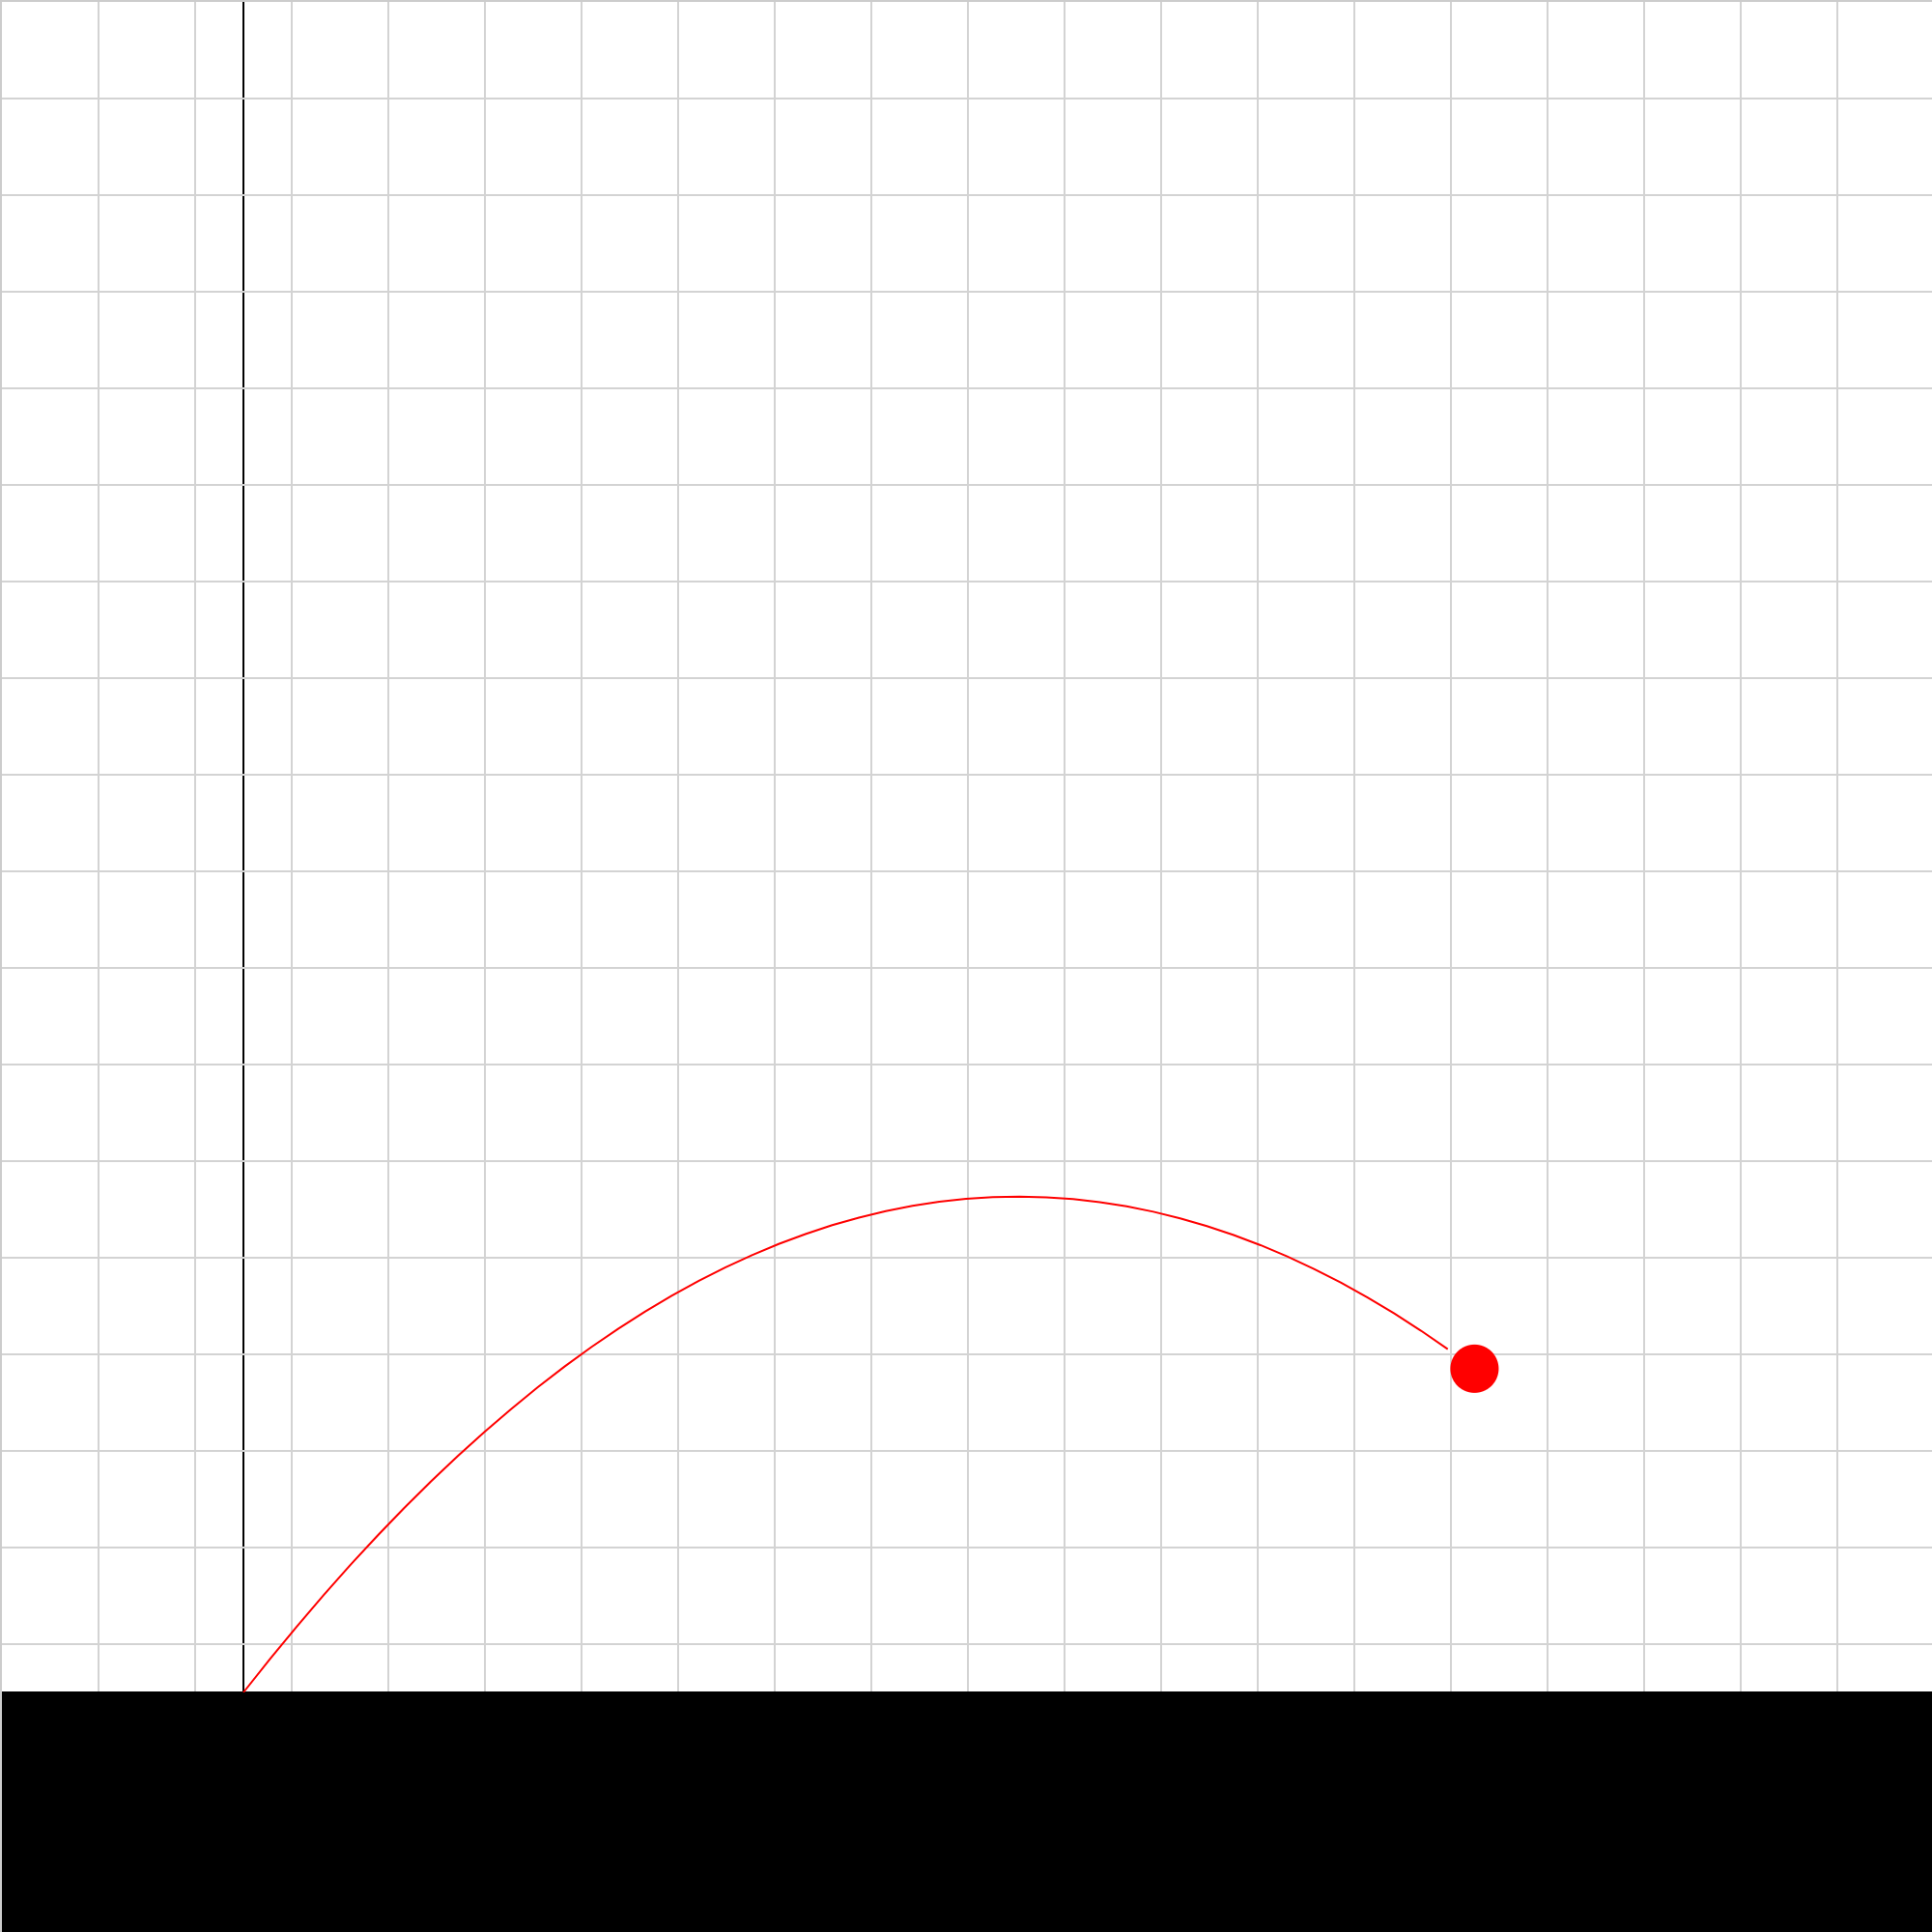
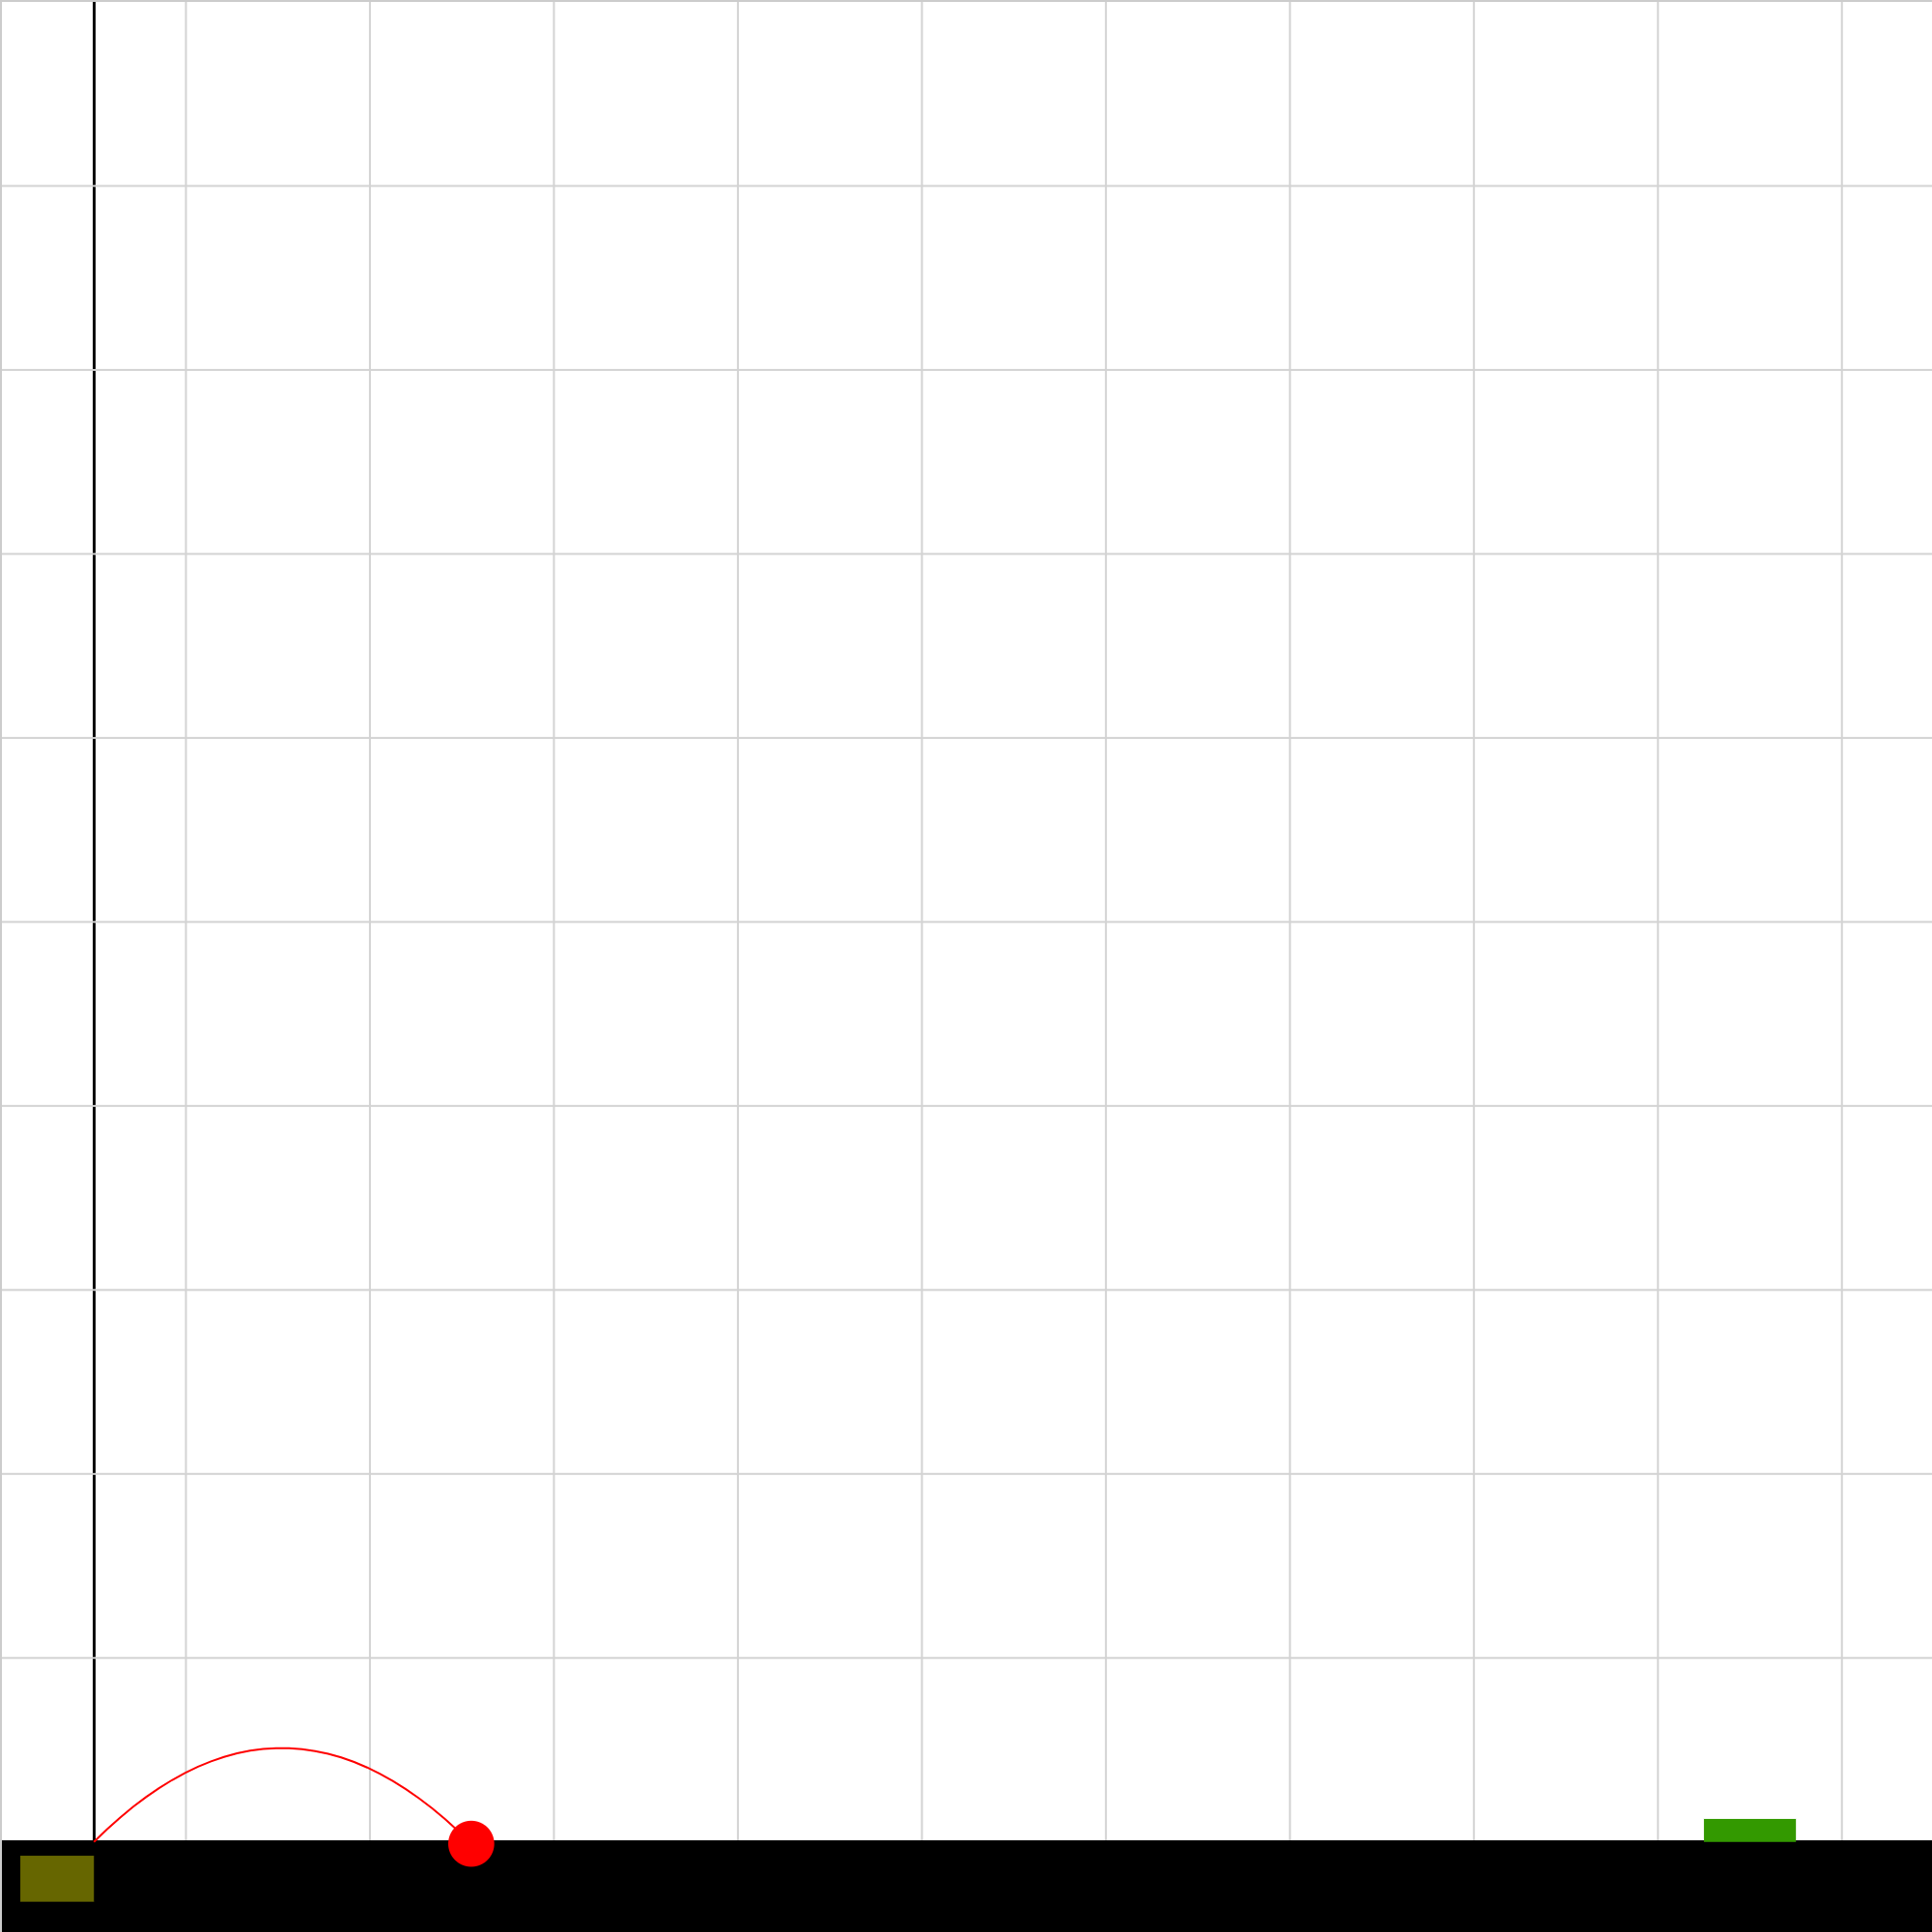
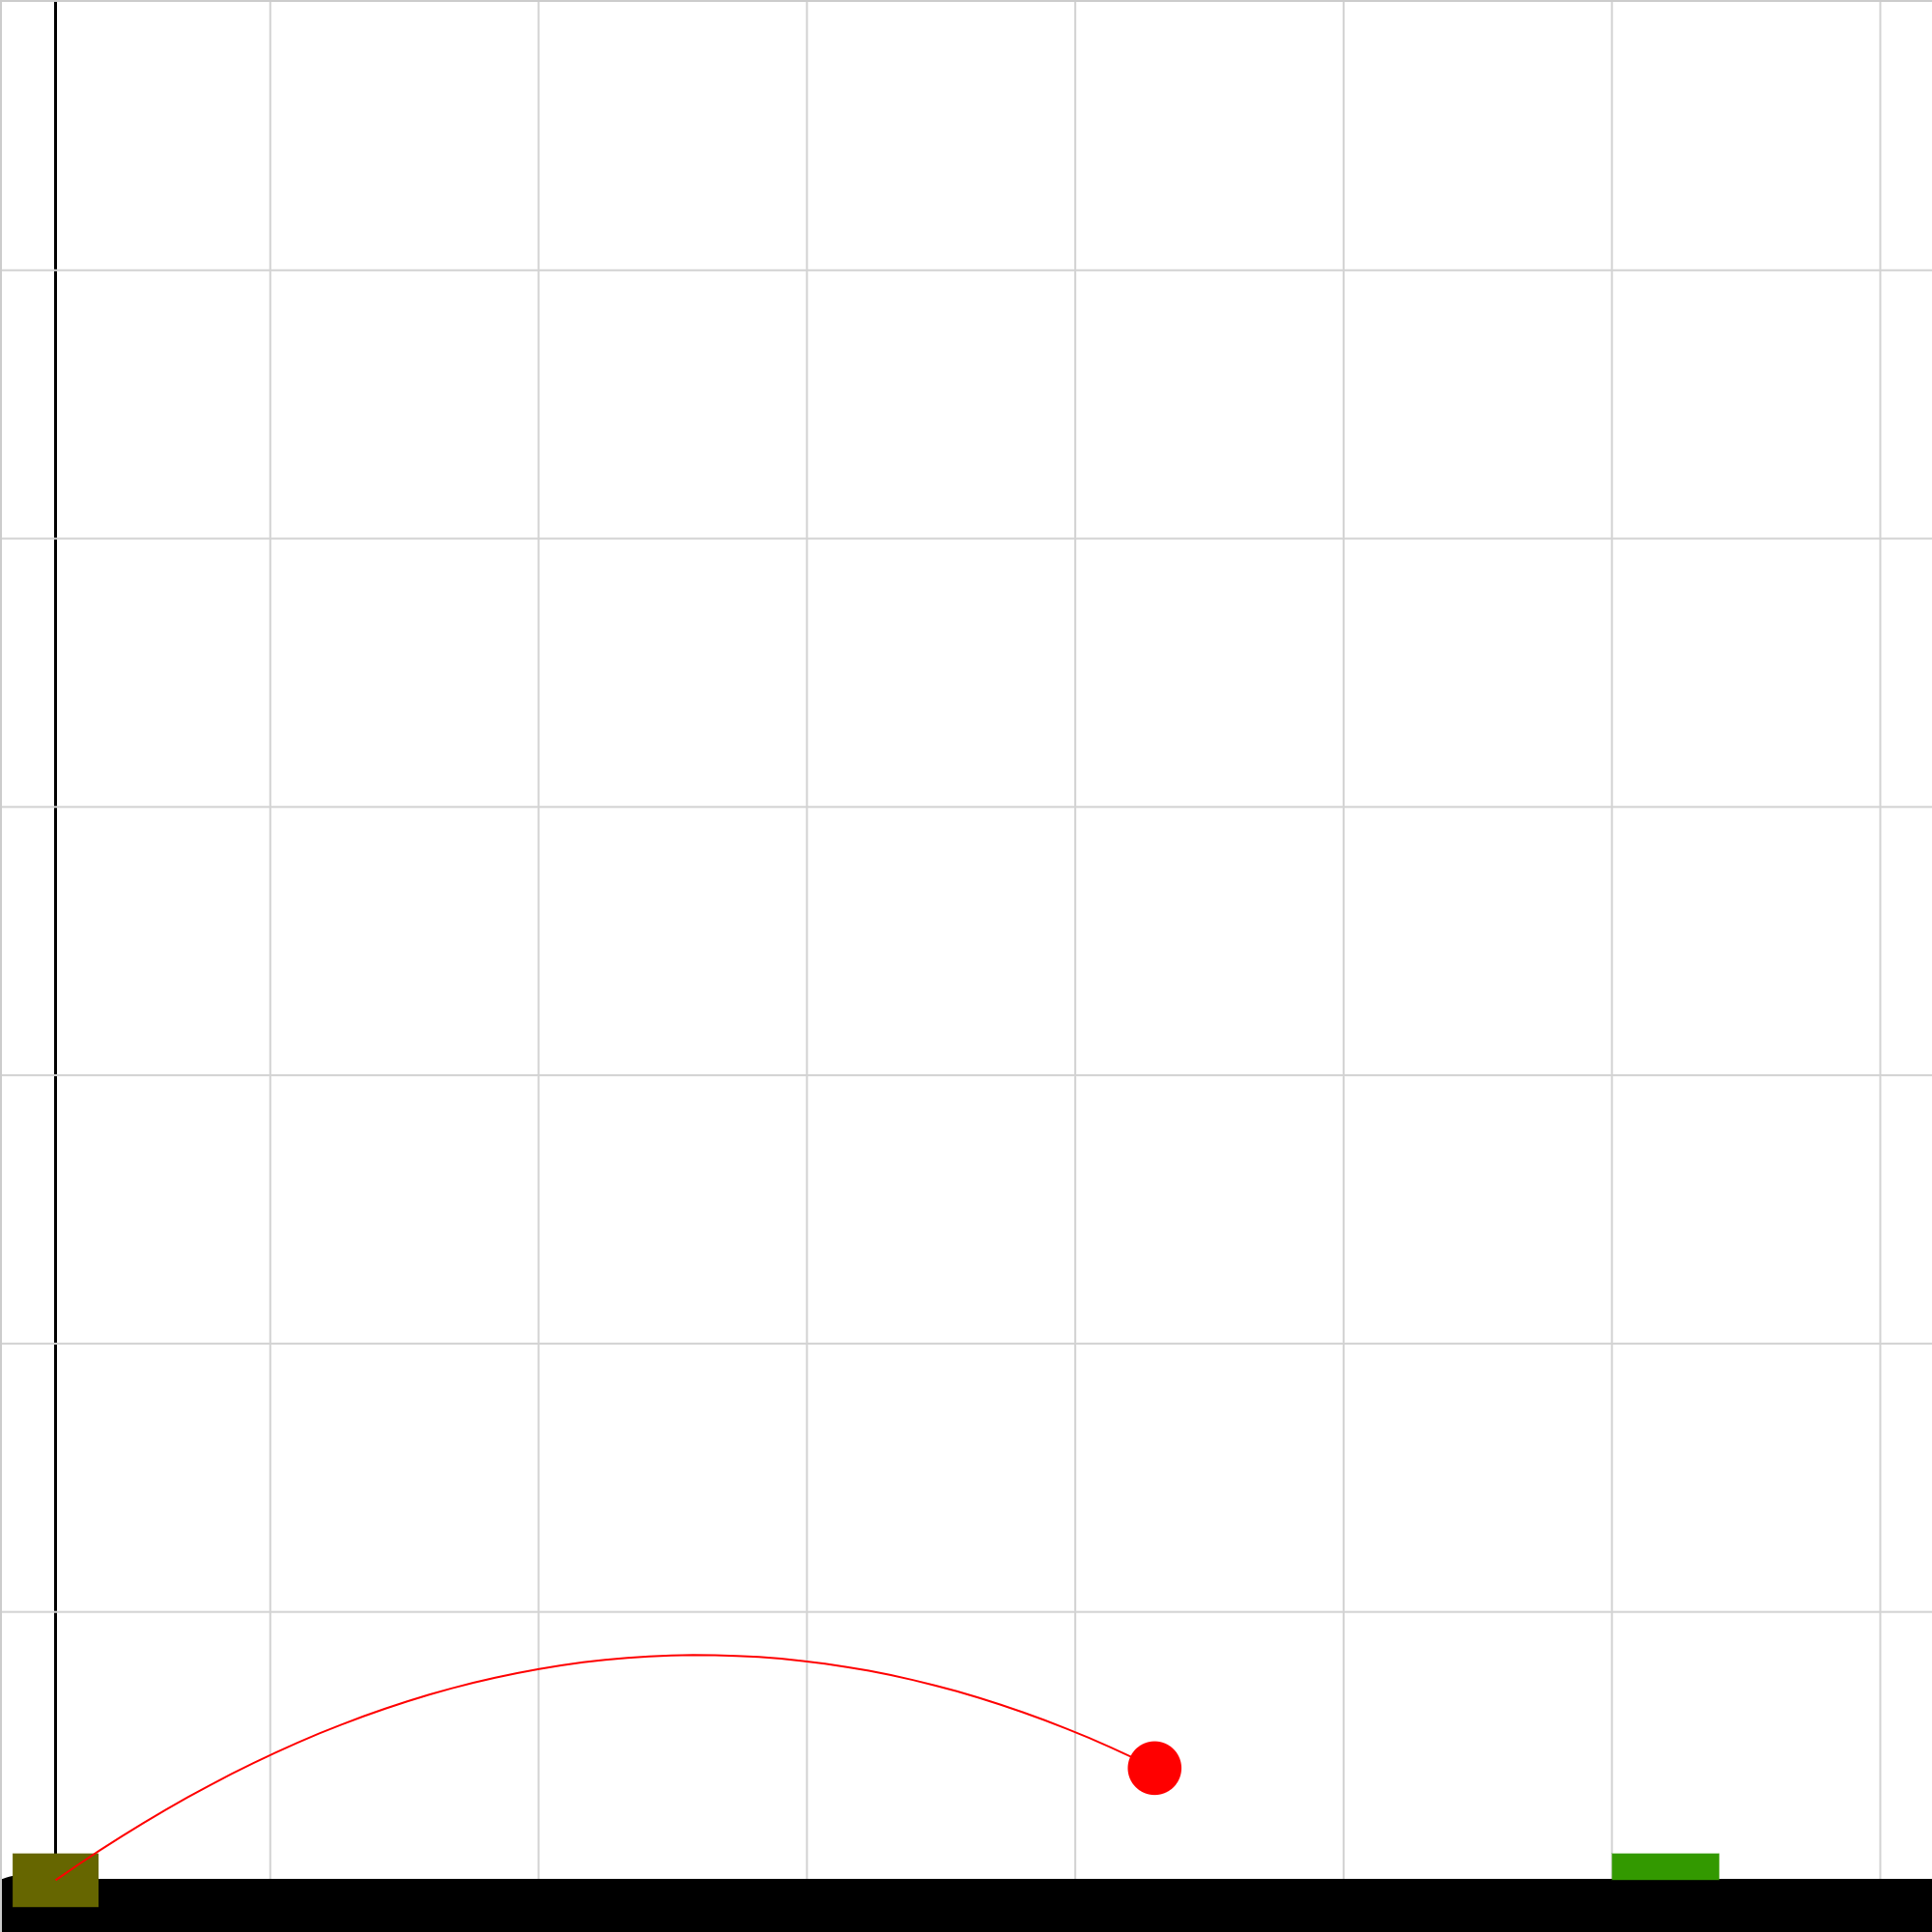
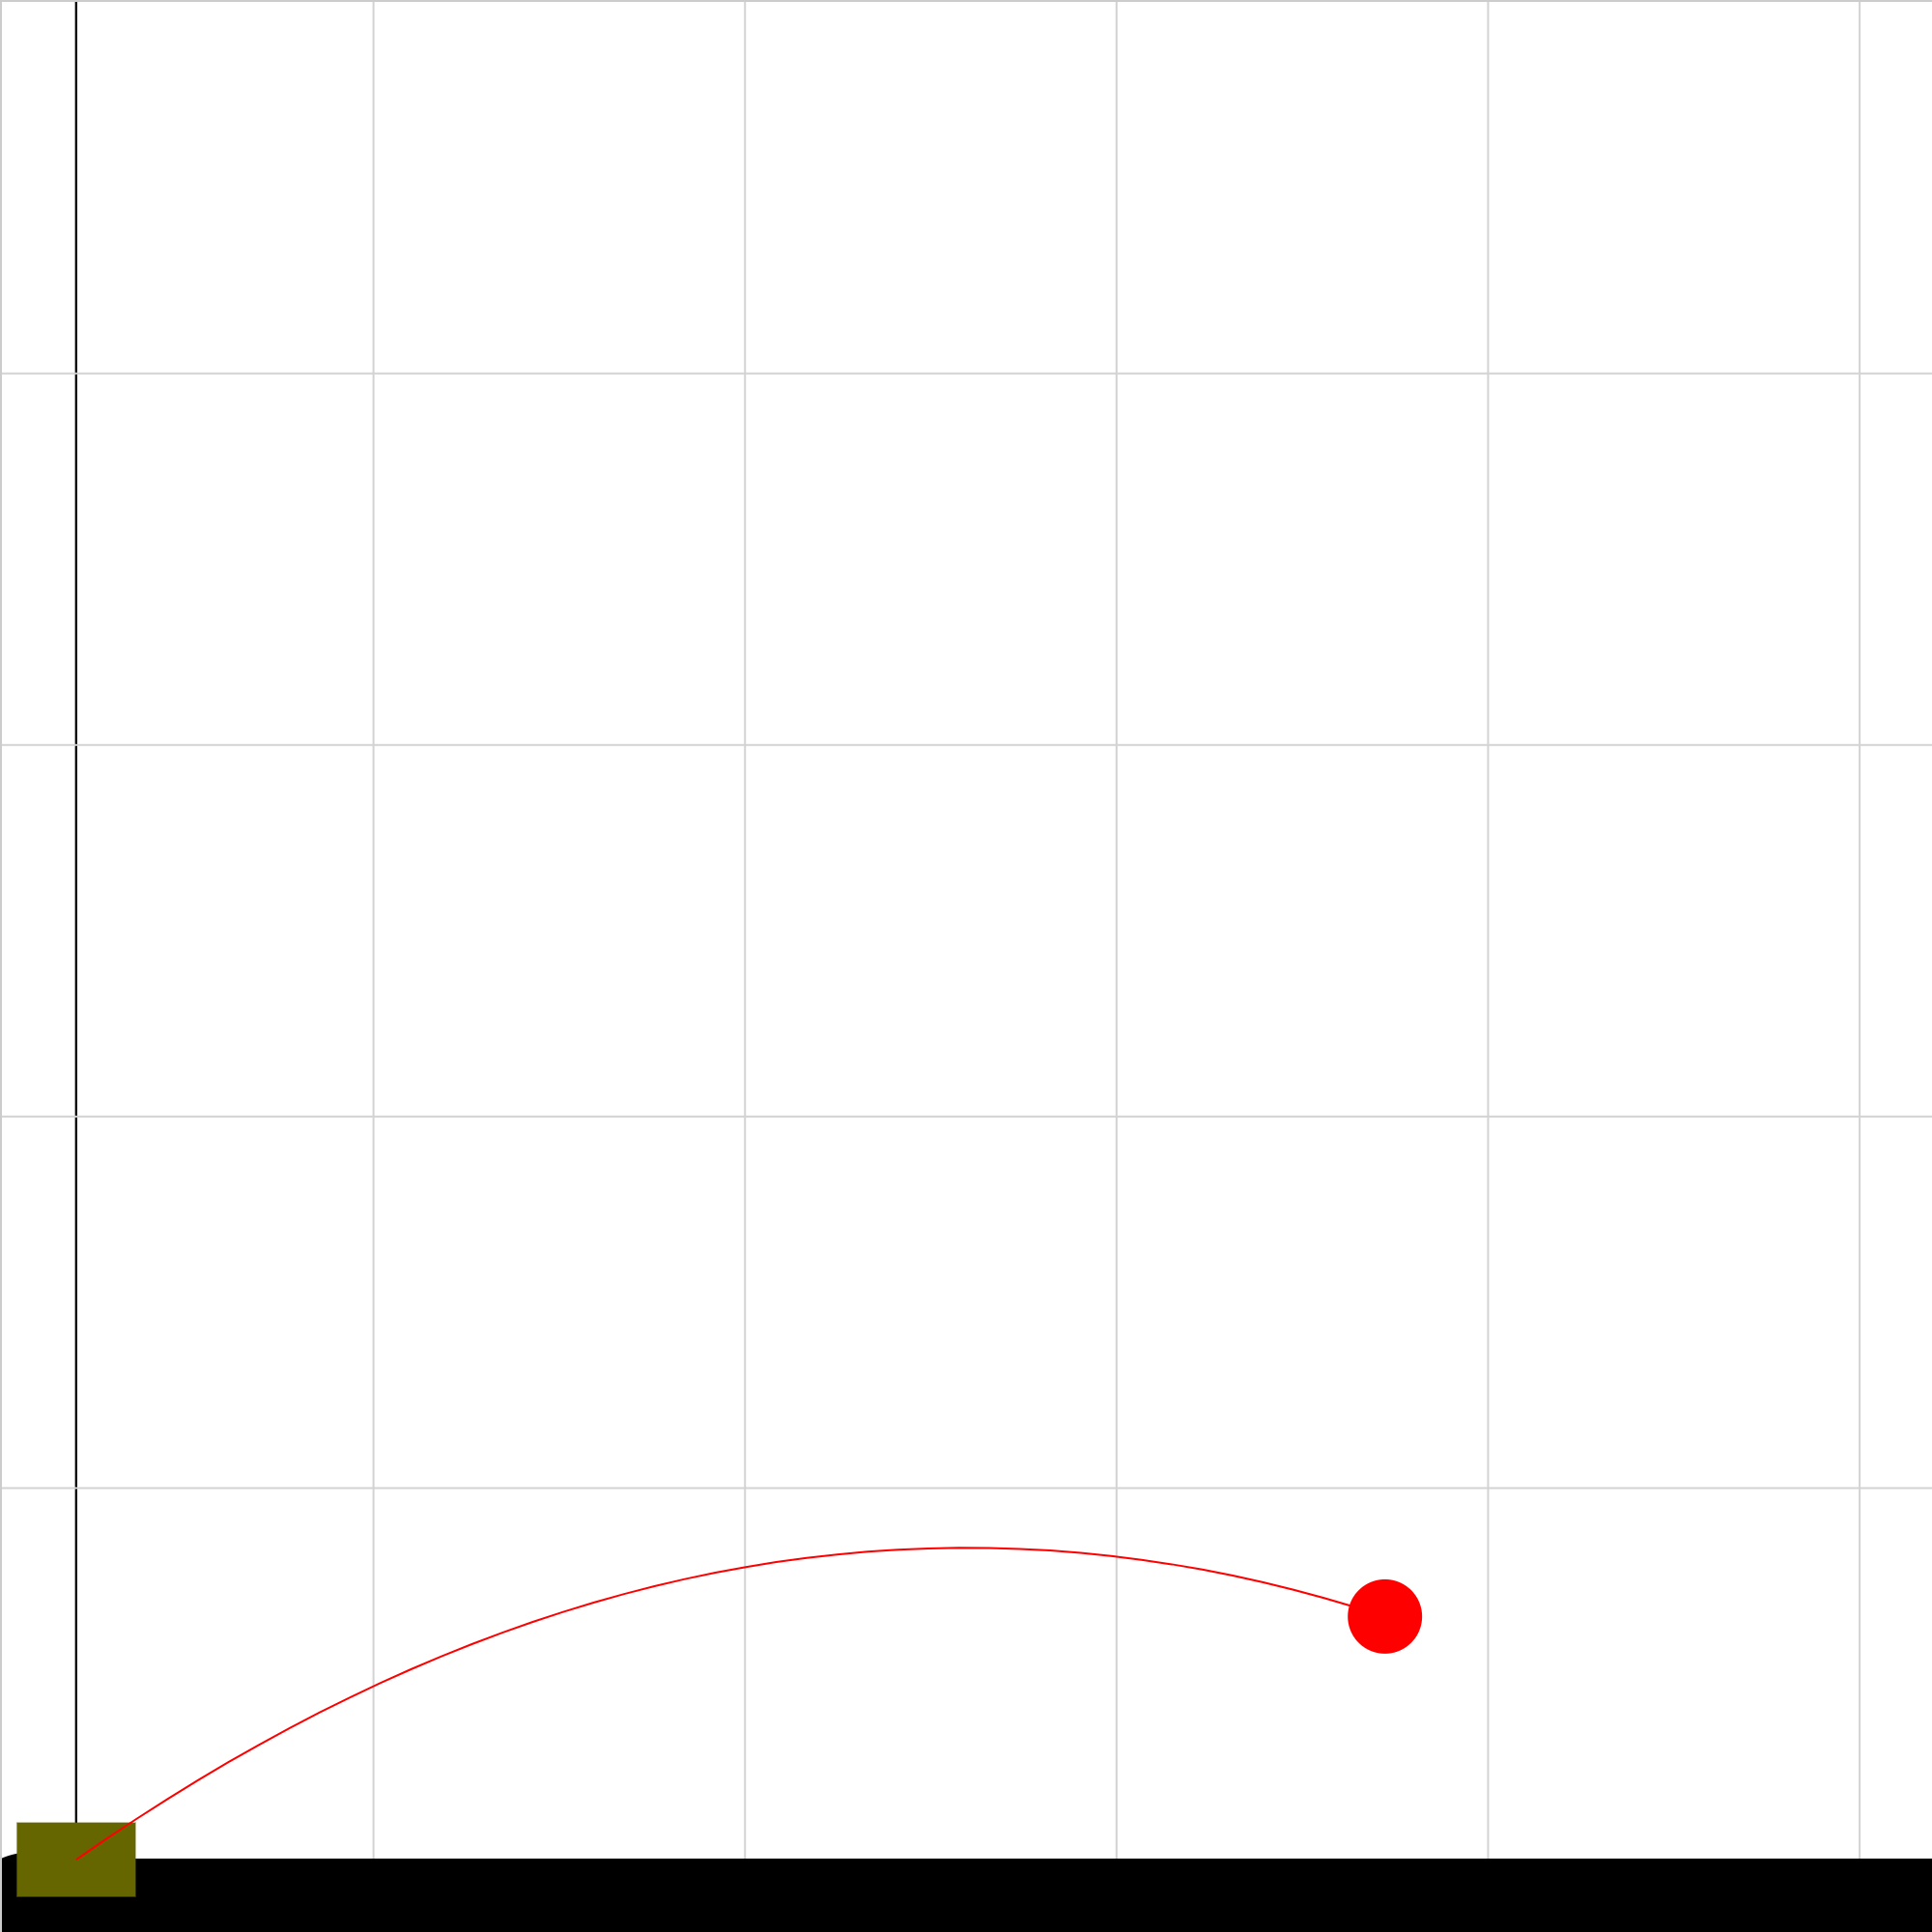
projectile-problem-3.iwp
A projectile is launched at an angle from ground level. Determine the initial velocity of the projectile. The grid spacing is 2.0 m.
projectile-template-2.iwp
A projectile is launched at an angle from a cliff. A target moves at 0, constant, or uniformly changing velocity. Hit the target with the projectile. Velocity vectors are shown on the projectile.
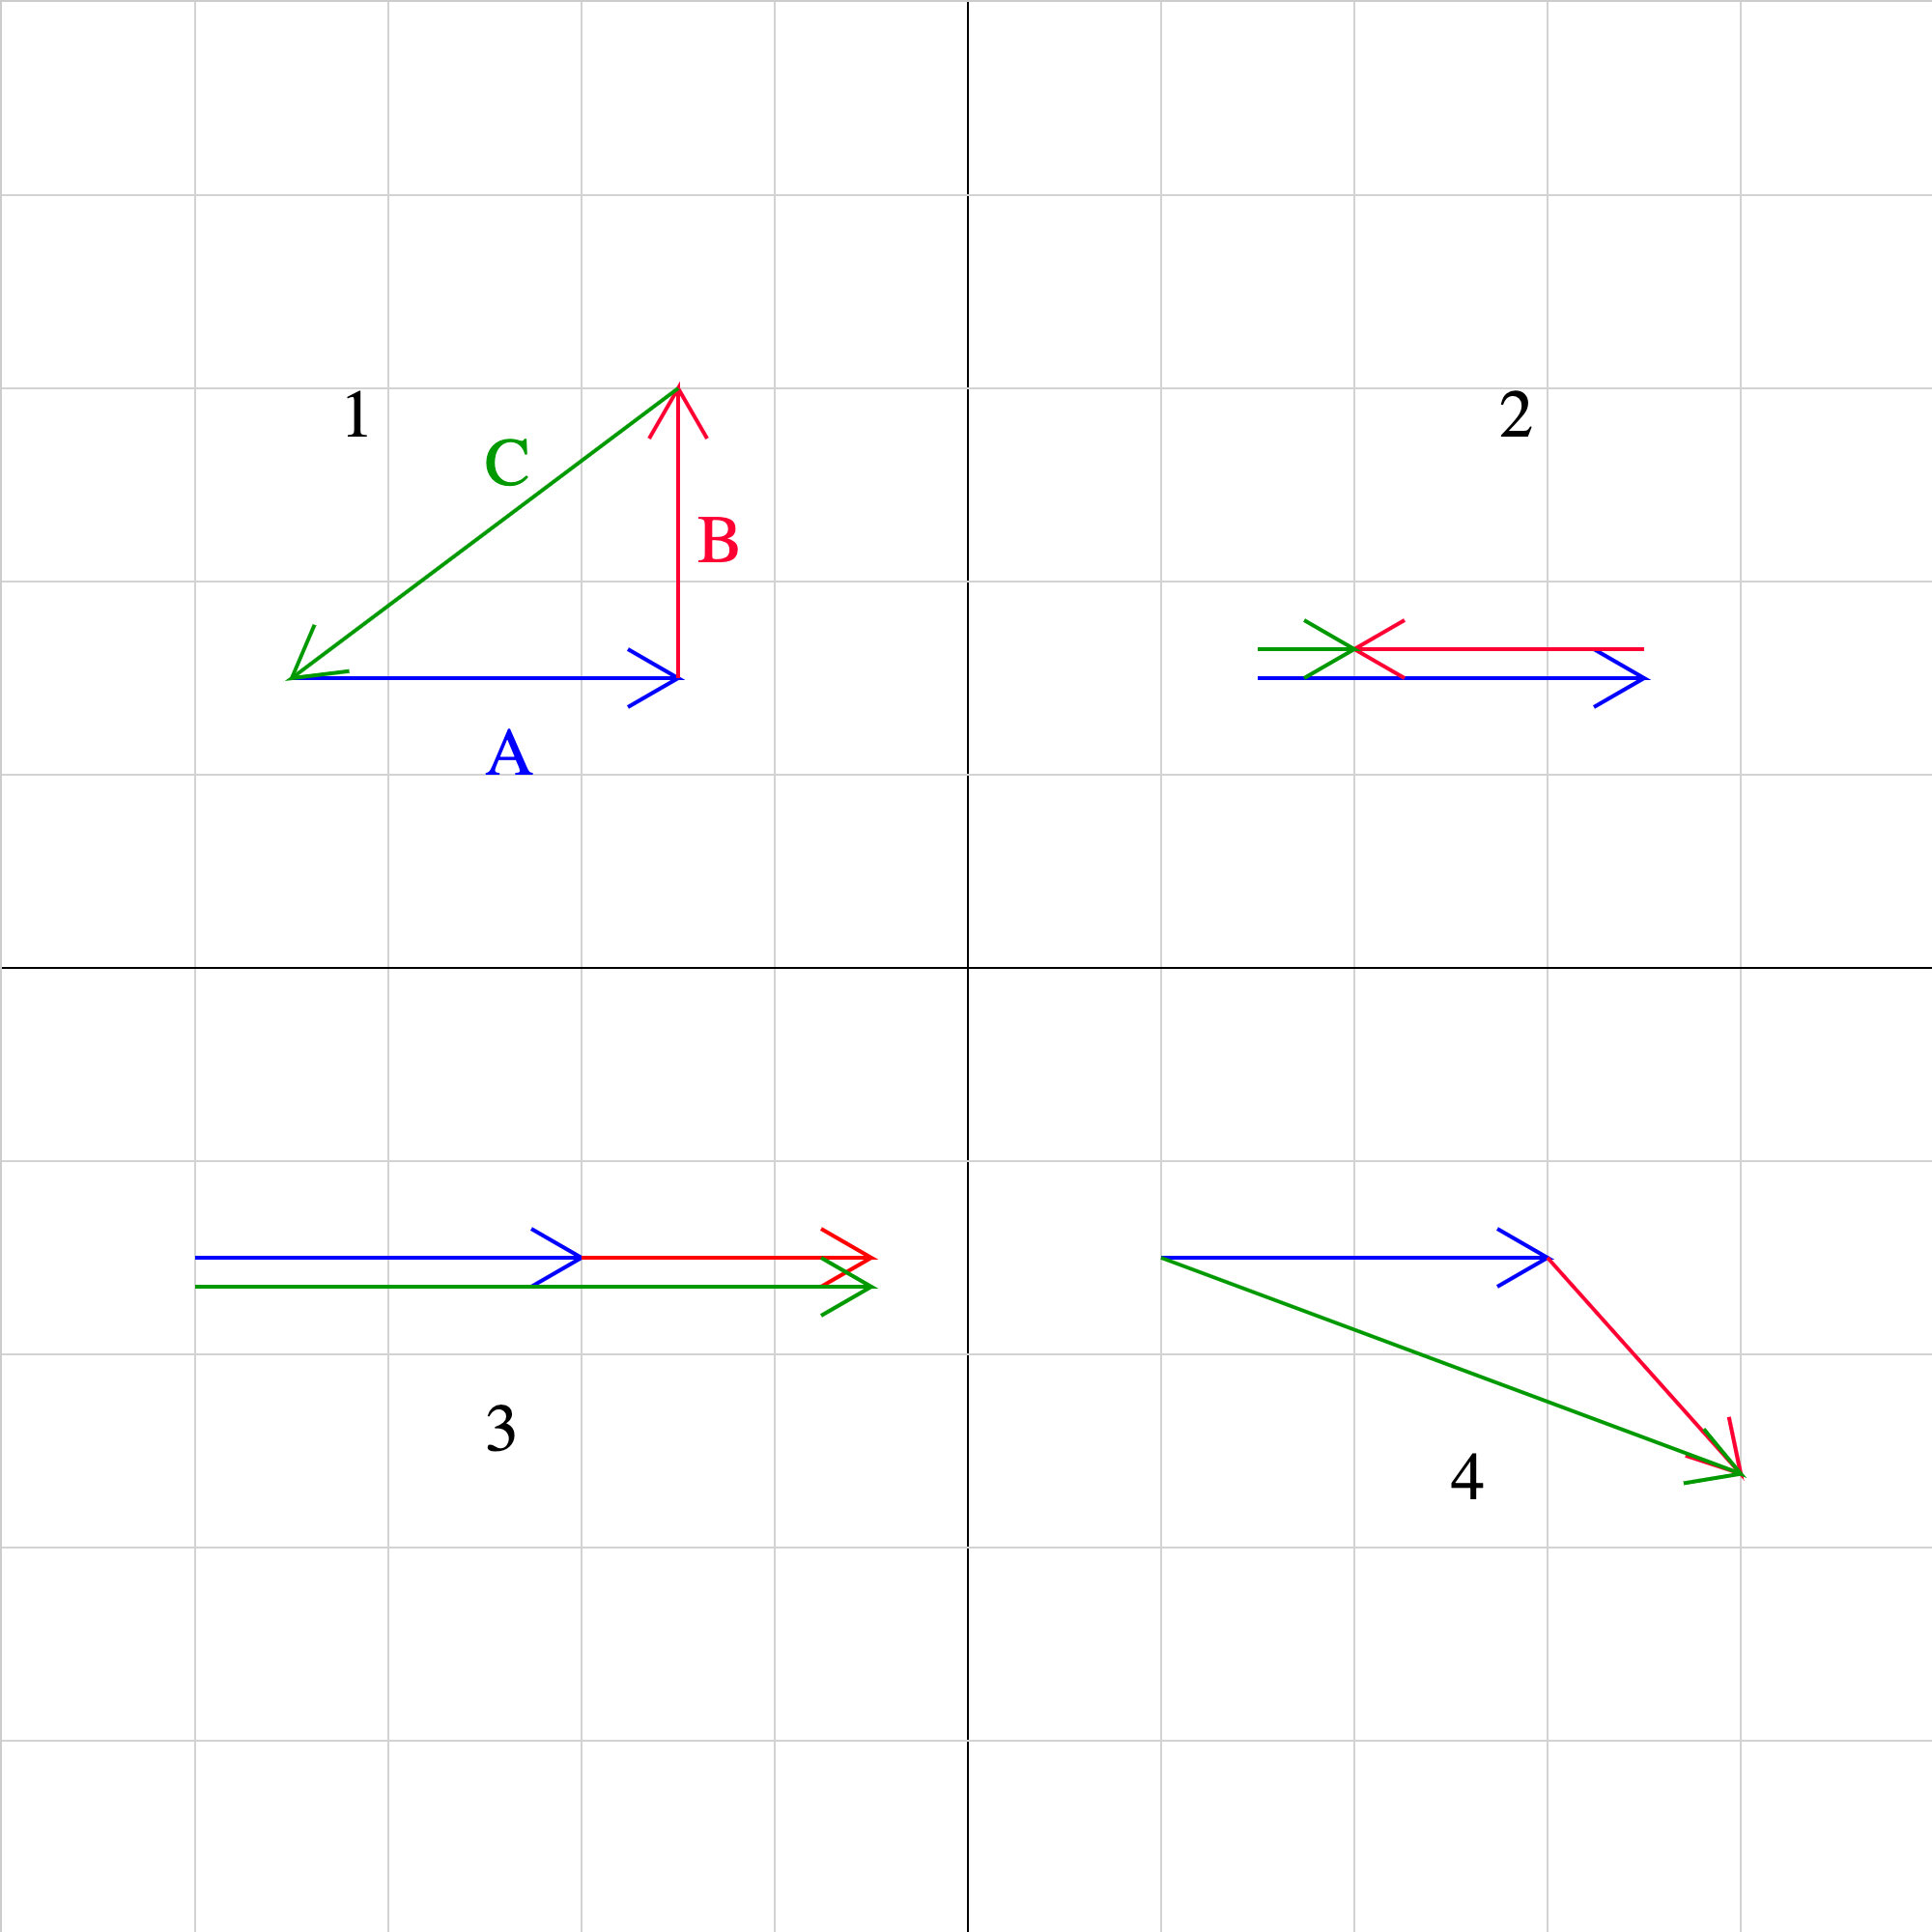
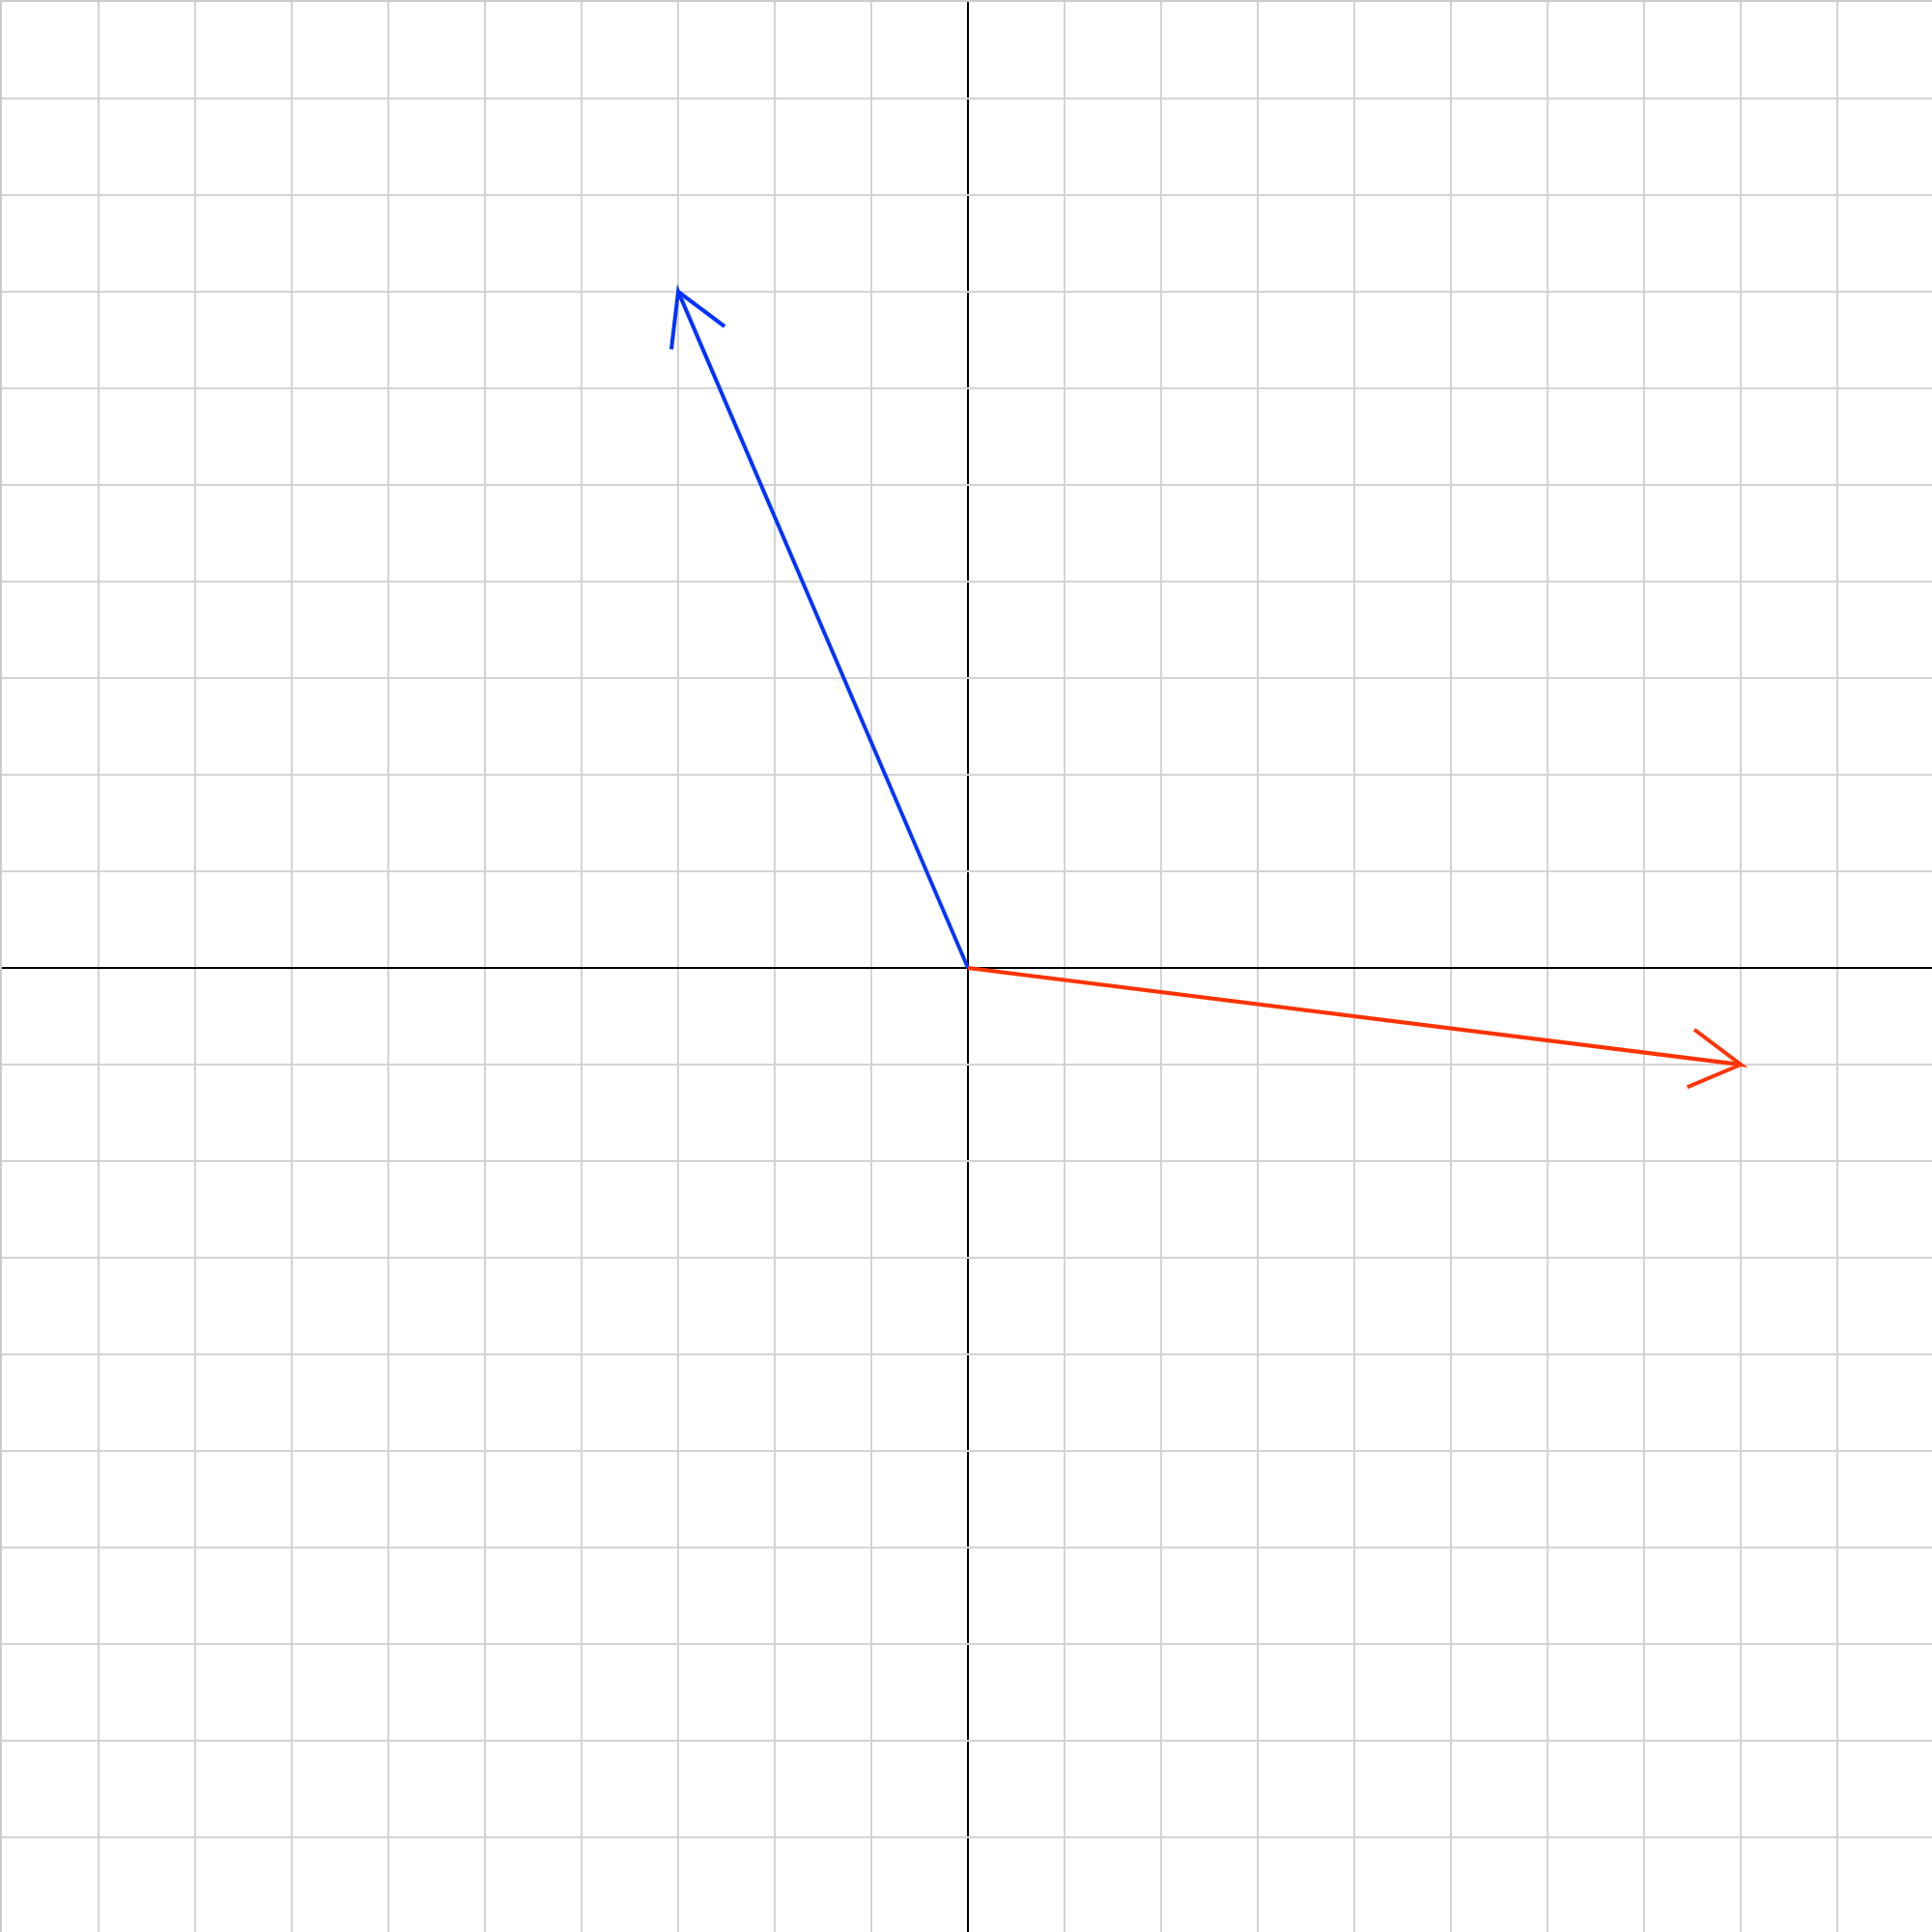
vector02.iwp
Each of the numbered diagrams shows three vectors. In each diagram, the blue vector is A, the red vector B, and the green vector C. For which diagrams do two of the vectors add to produce the third, and for which diagrams do the three vectors add to 0?
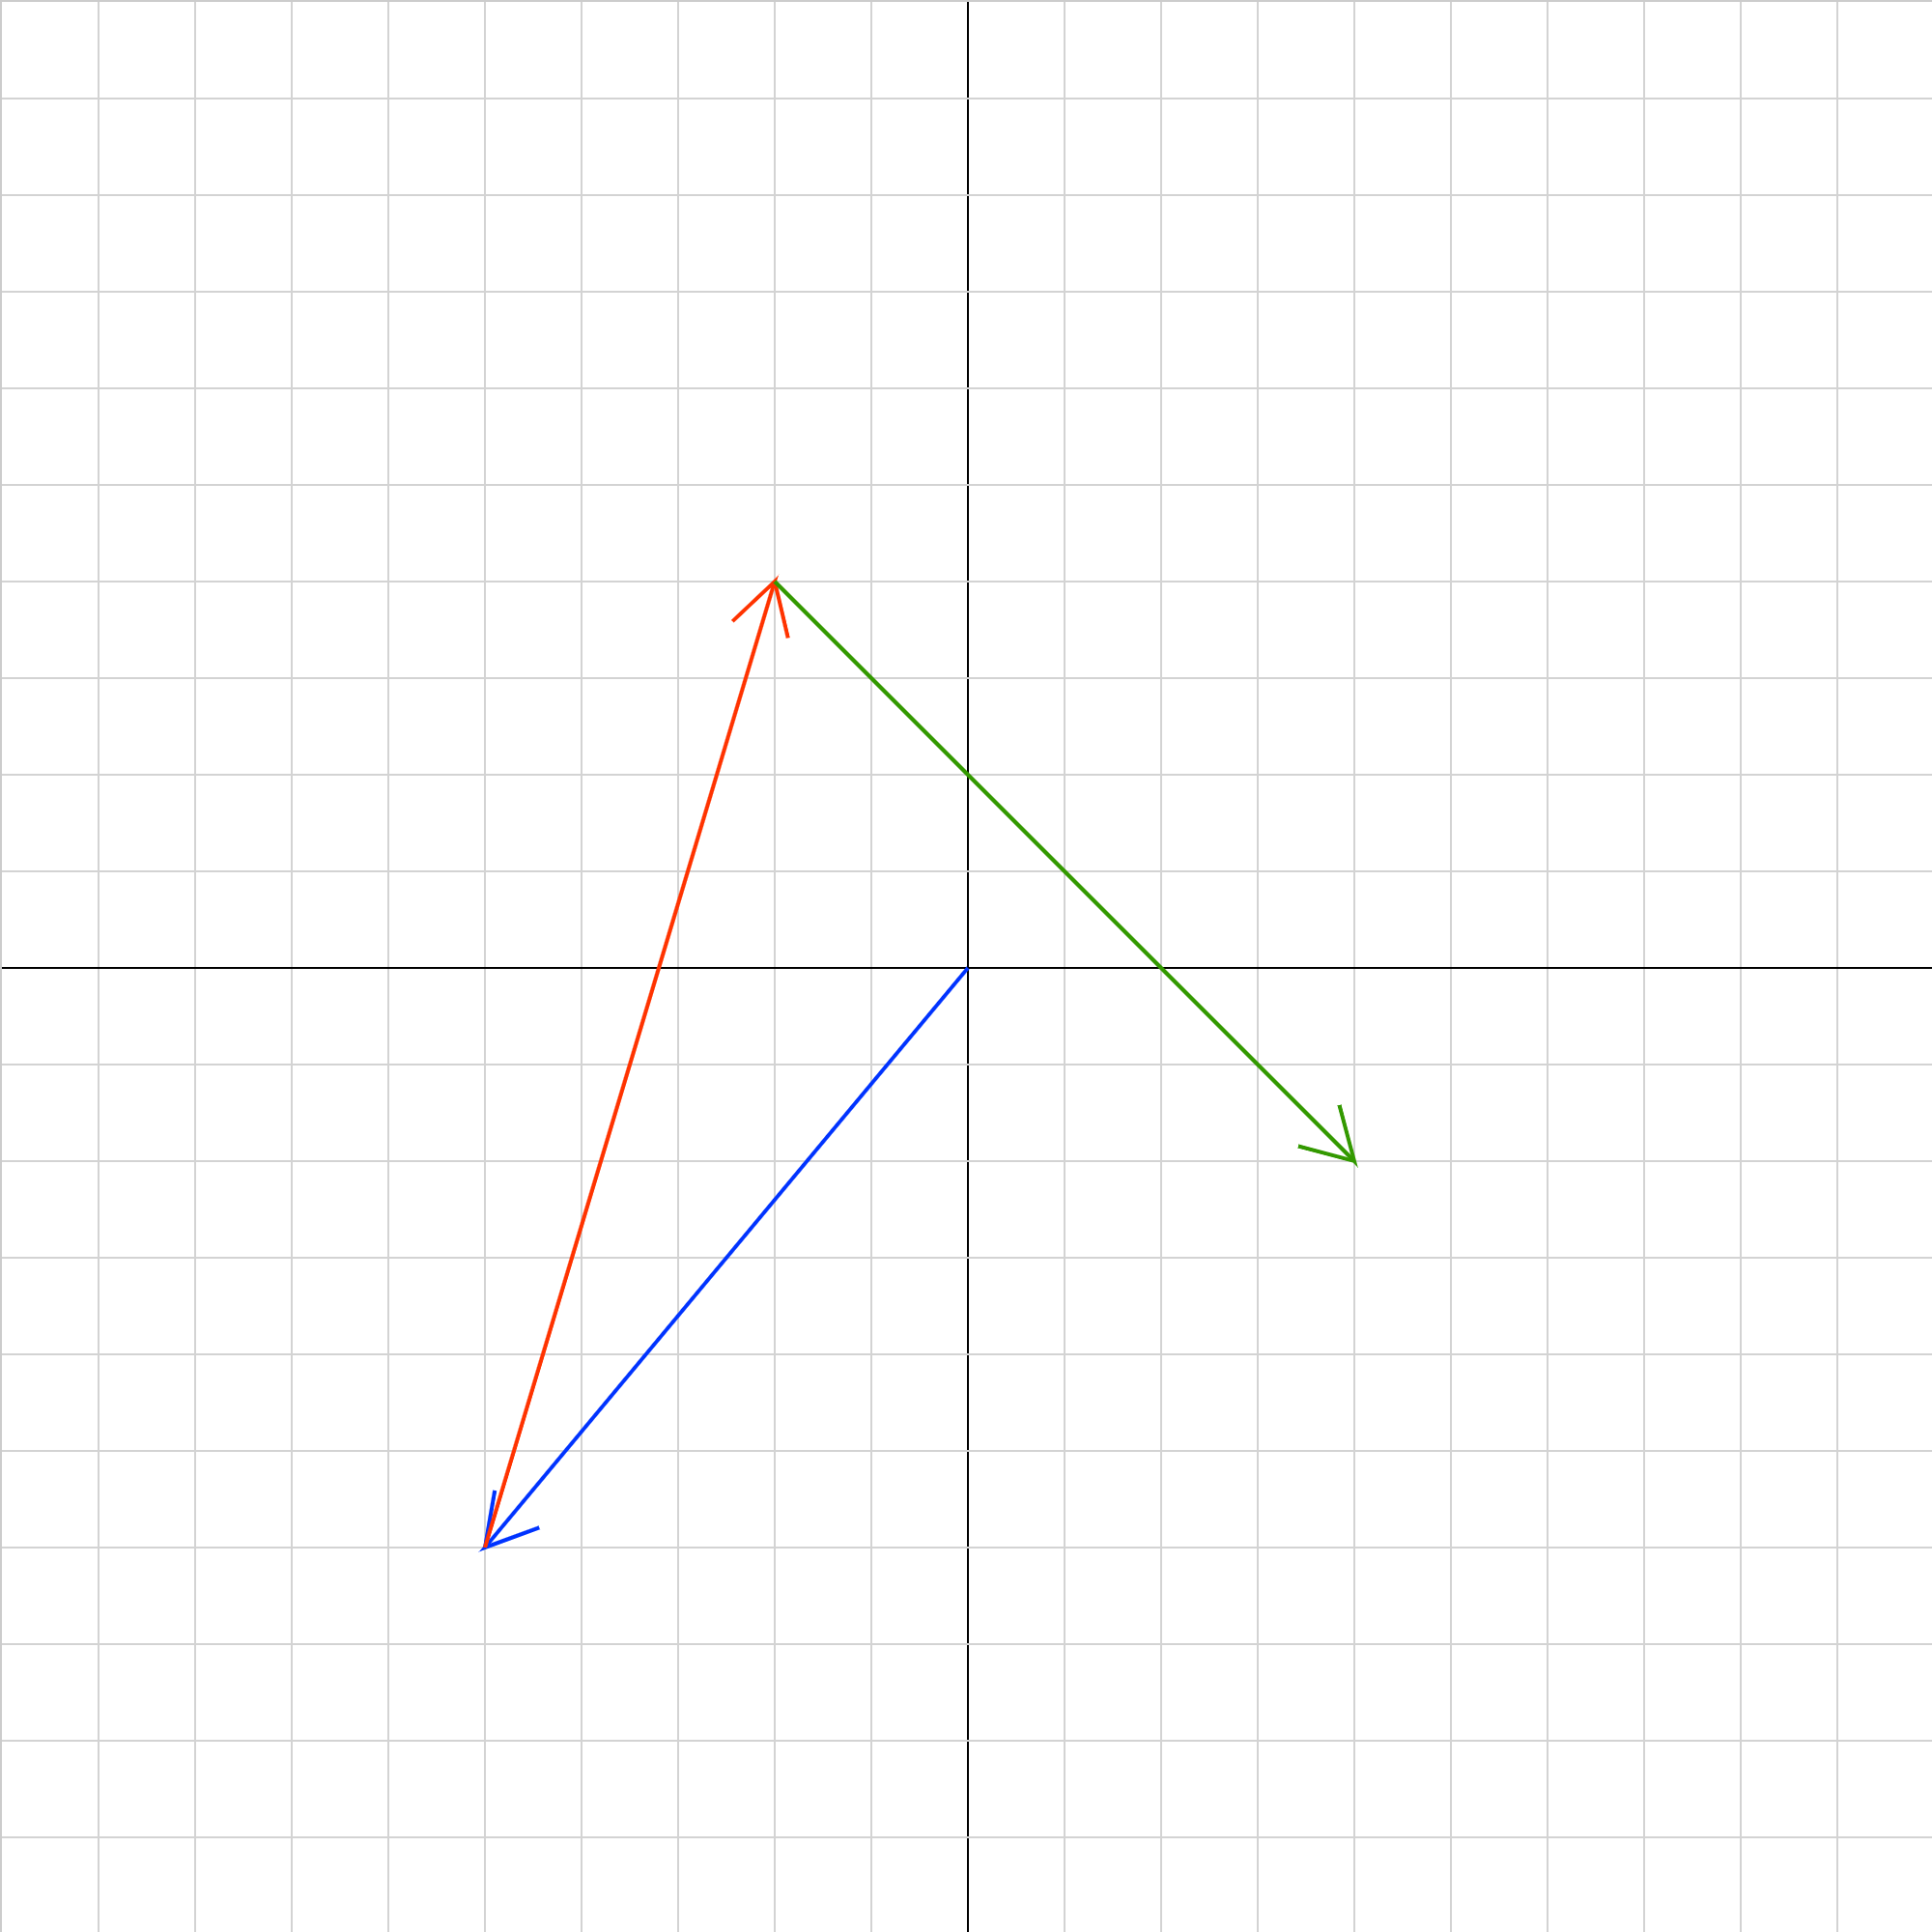
vector03.iwp
What are the components, magnitude, and direction of the sum of the 3 vectors shown?
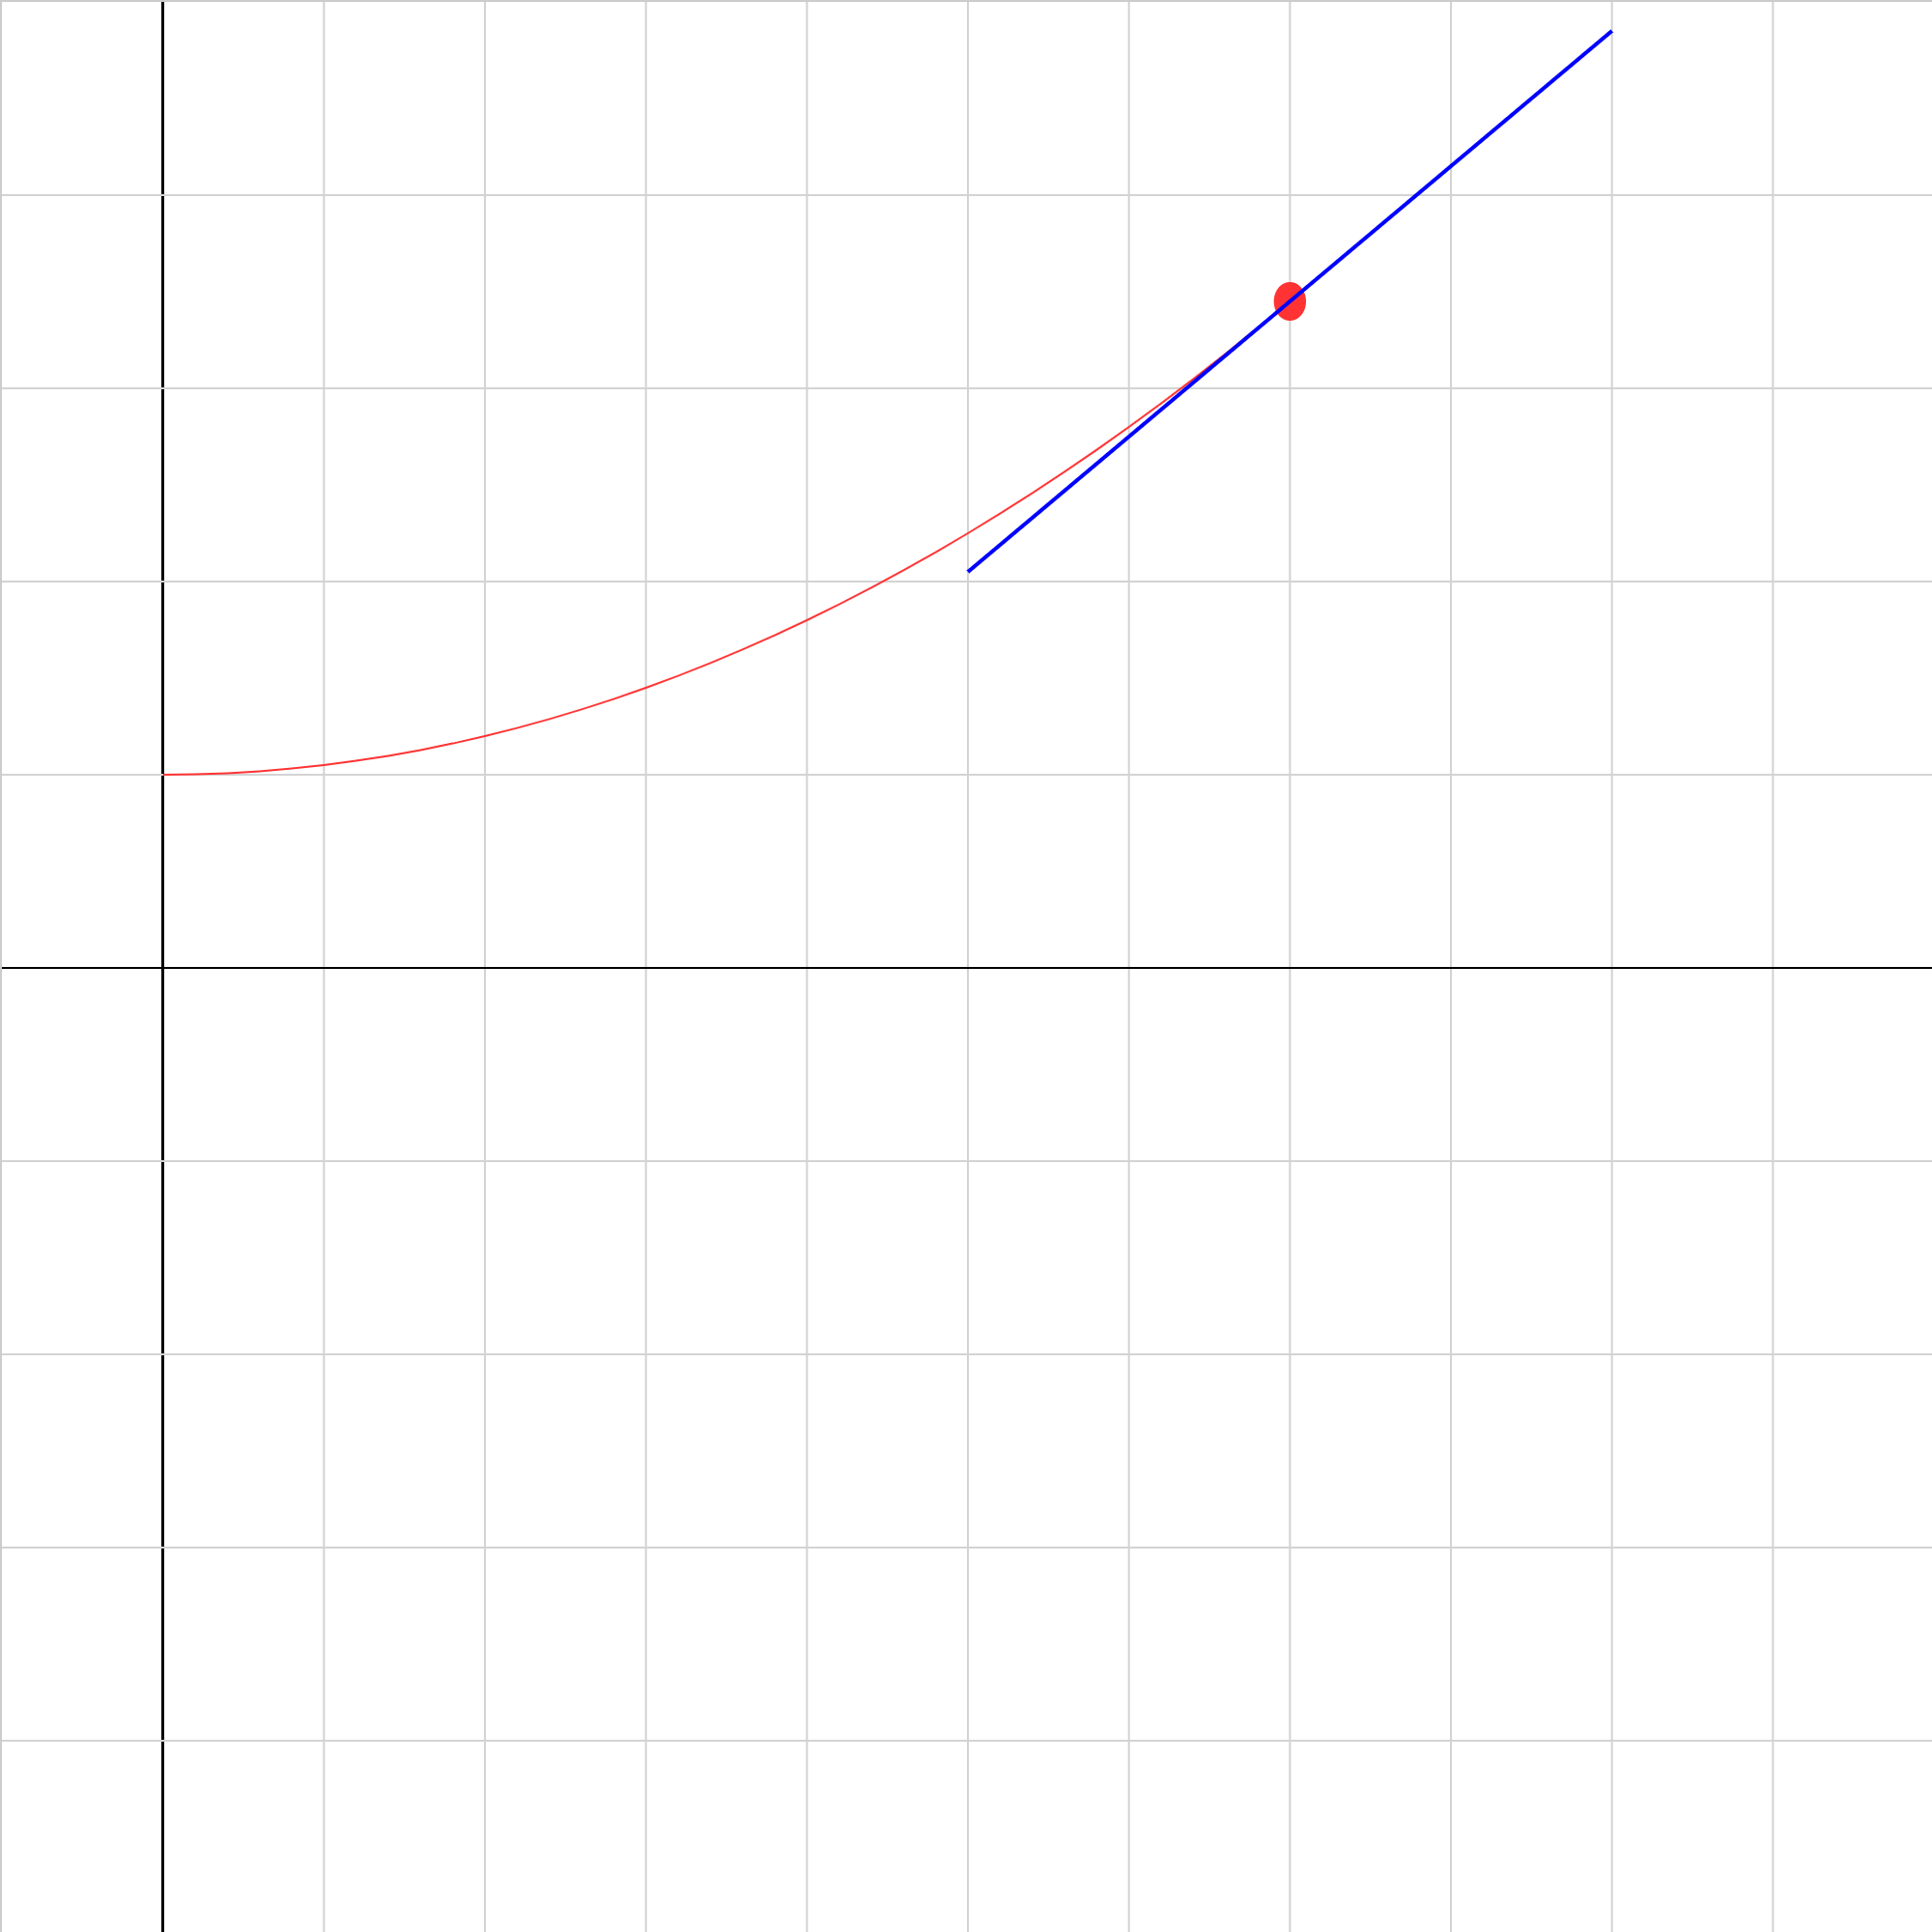
velocity01b.iwp
Play the animation to show a position vs. time graph of a uniformly-accelerating object. The blue line remains tangent to the path of the object. Therefore, the slope of the blue line is the instantaneous velocity of the object. Its value is given above the play buttons. Predict how a graph of velocity vs. time will appear. Then click on Show Graph to display a velocity vs. time graph of the motion.
velocity02b.iwp
The situation is similar to the last problem but with different initial values. Change the inputs in order to model the motion of an object thrown vertically from the ground (initial position of 0 m) at 25 m/s. (What should you input for the acceleration?). Type in values of initial position, initial velocity, and acceleration and run the animation. Remember to click Reset whenever you change an input. Click Show graph to show velocity vs. time and acceleration vs. time graphs.
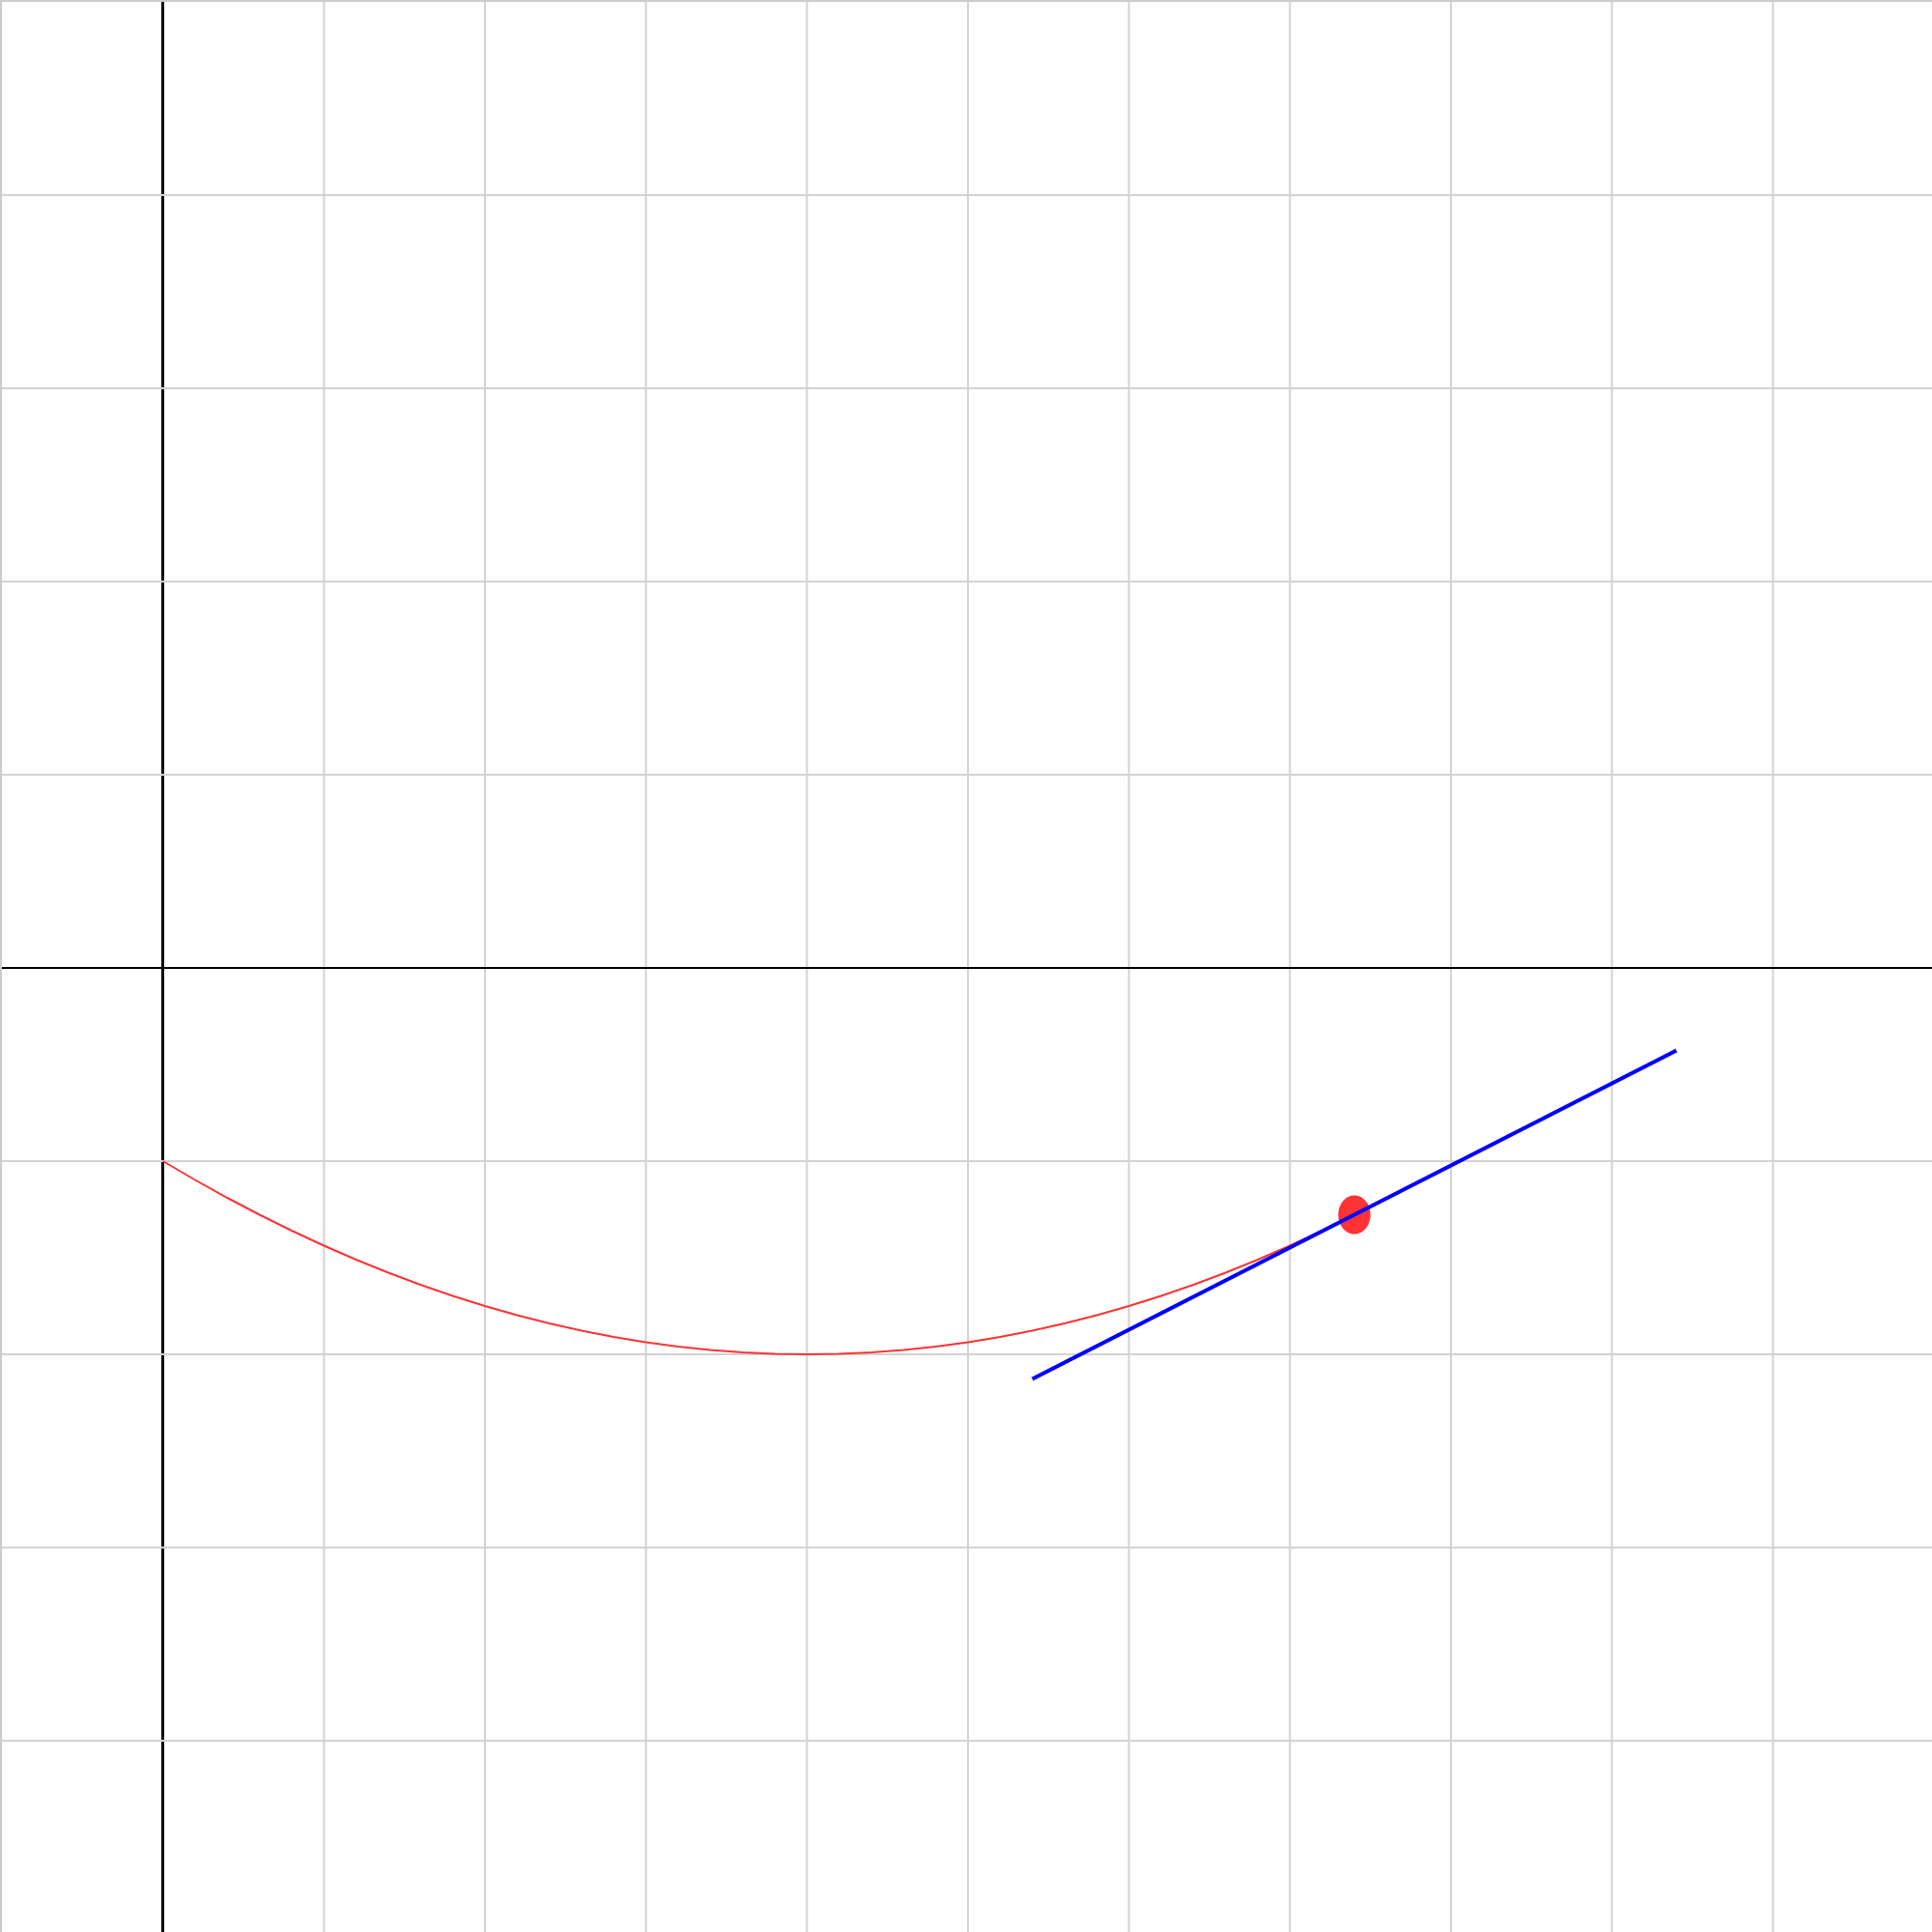
velocity04.iwp
A position vs. time graph of a uniformly-accelerating object is shown. The blue line is always tangent to the path of the object. Determine the acceleration of the object by first finding the velocities at two instants of time. (Note that for this problem the graph display has been disabled.)
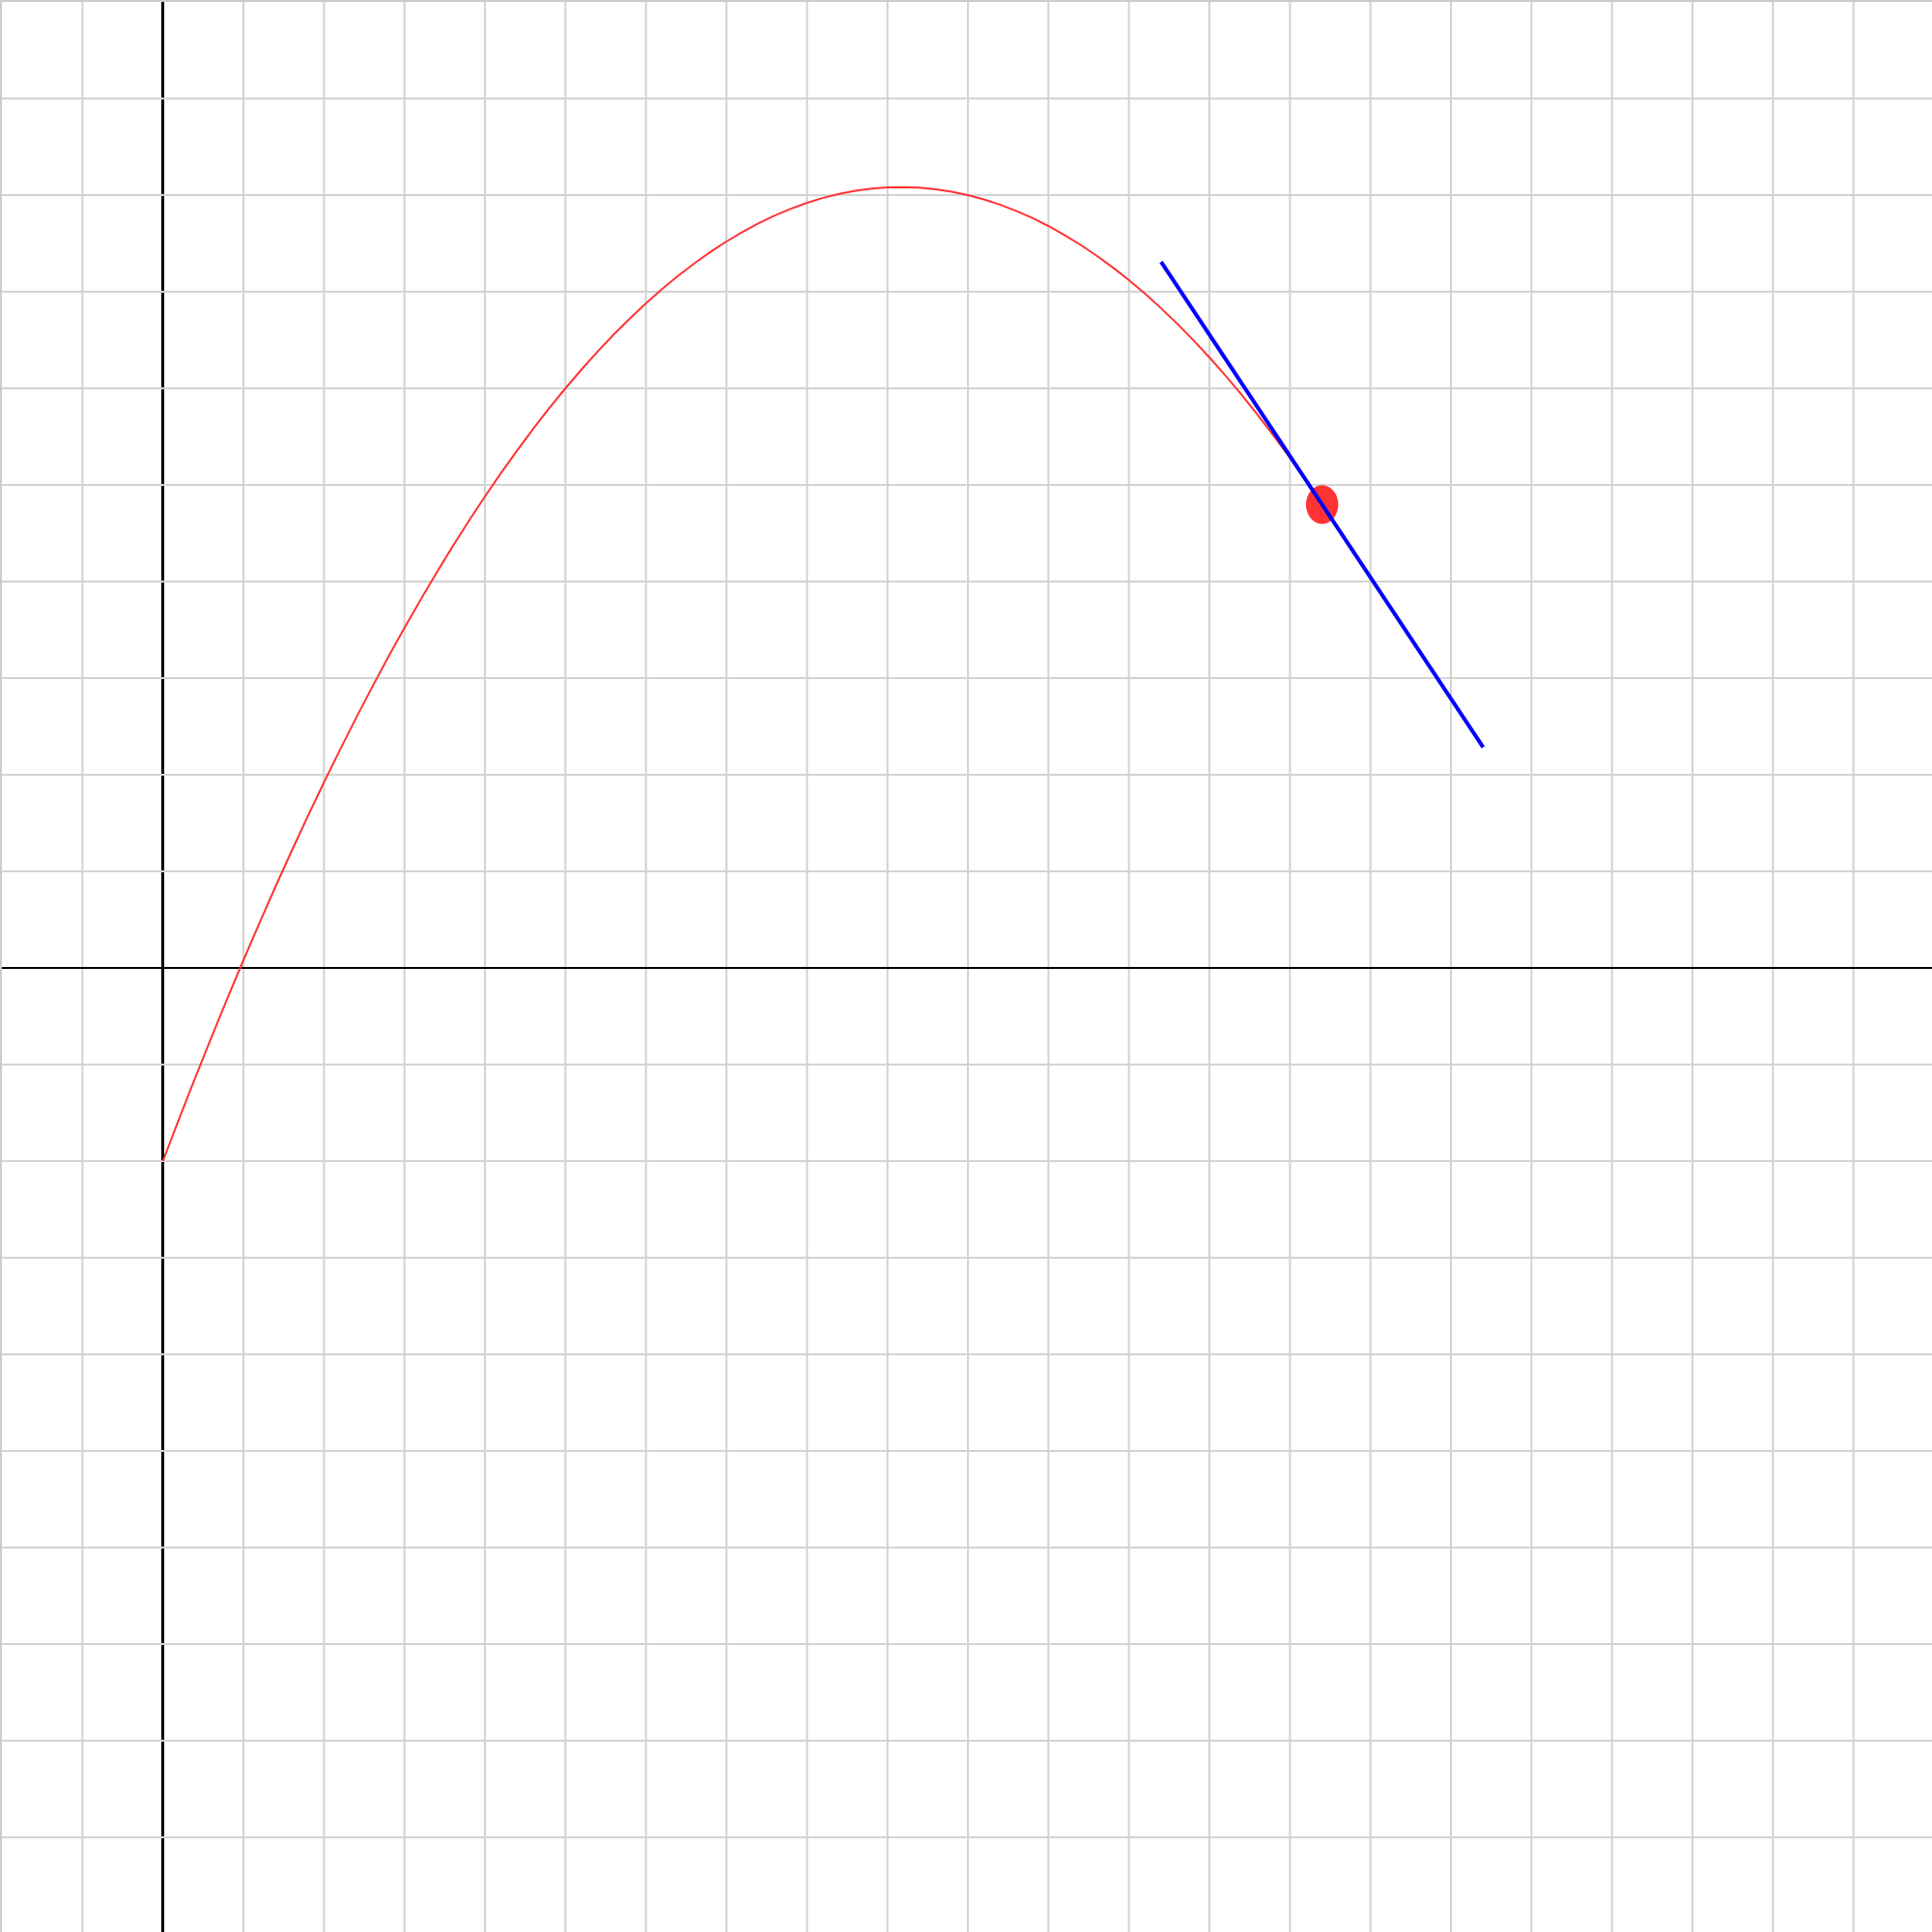
velocity06.iwp
Play the animation to show a position vs. time graph of a uniformly-accelerating object. Determine the acceleration of the object.